A few days back, we introduced a new Web Survey Distribution Panel. Now we're bringing you more enhancements to it.
Website Survey Enhancements - Silently market your brands across all your customer's touchpoints with our website widget surveys.
While you're using Web Surveys, you can now use onClose, onOpen, and onSubmit methods to trigger new actions or functions and control the user journey.
For Example,
- If you'd like to redirect the website visitor to a different page once they've submitted a survey, you can use the onSubmit function.
- If you want to track the total number of website visitors in your database to launch an offer or run a campaign, you can use the onClose function.
- If you run an airline company and tie a partnership with a retail store, this feature can be handy to promote their business by redirecting the website visitors once they've opened the survey, you can use the onOpen function.
📒These functions are not part of the Zonka Feedback embed code. They can be added and used by the user based on their use case on the website where they install the widgets.
Survey Themes
Why be in a group when you can stand apart? Design, style, and make your surveys the way you want.
Pick your favorite theme from our newly launched rich set of collections and go ahead, get creative to make them your own.
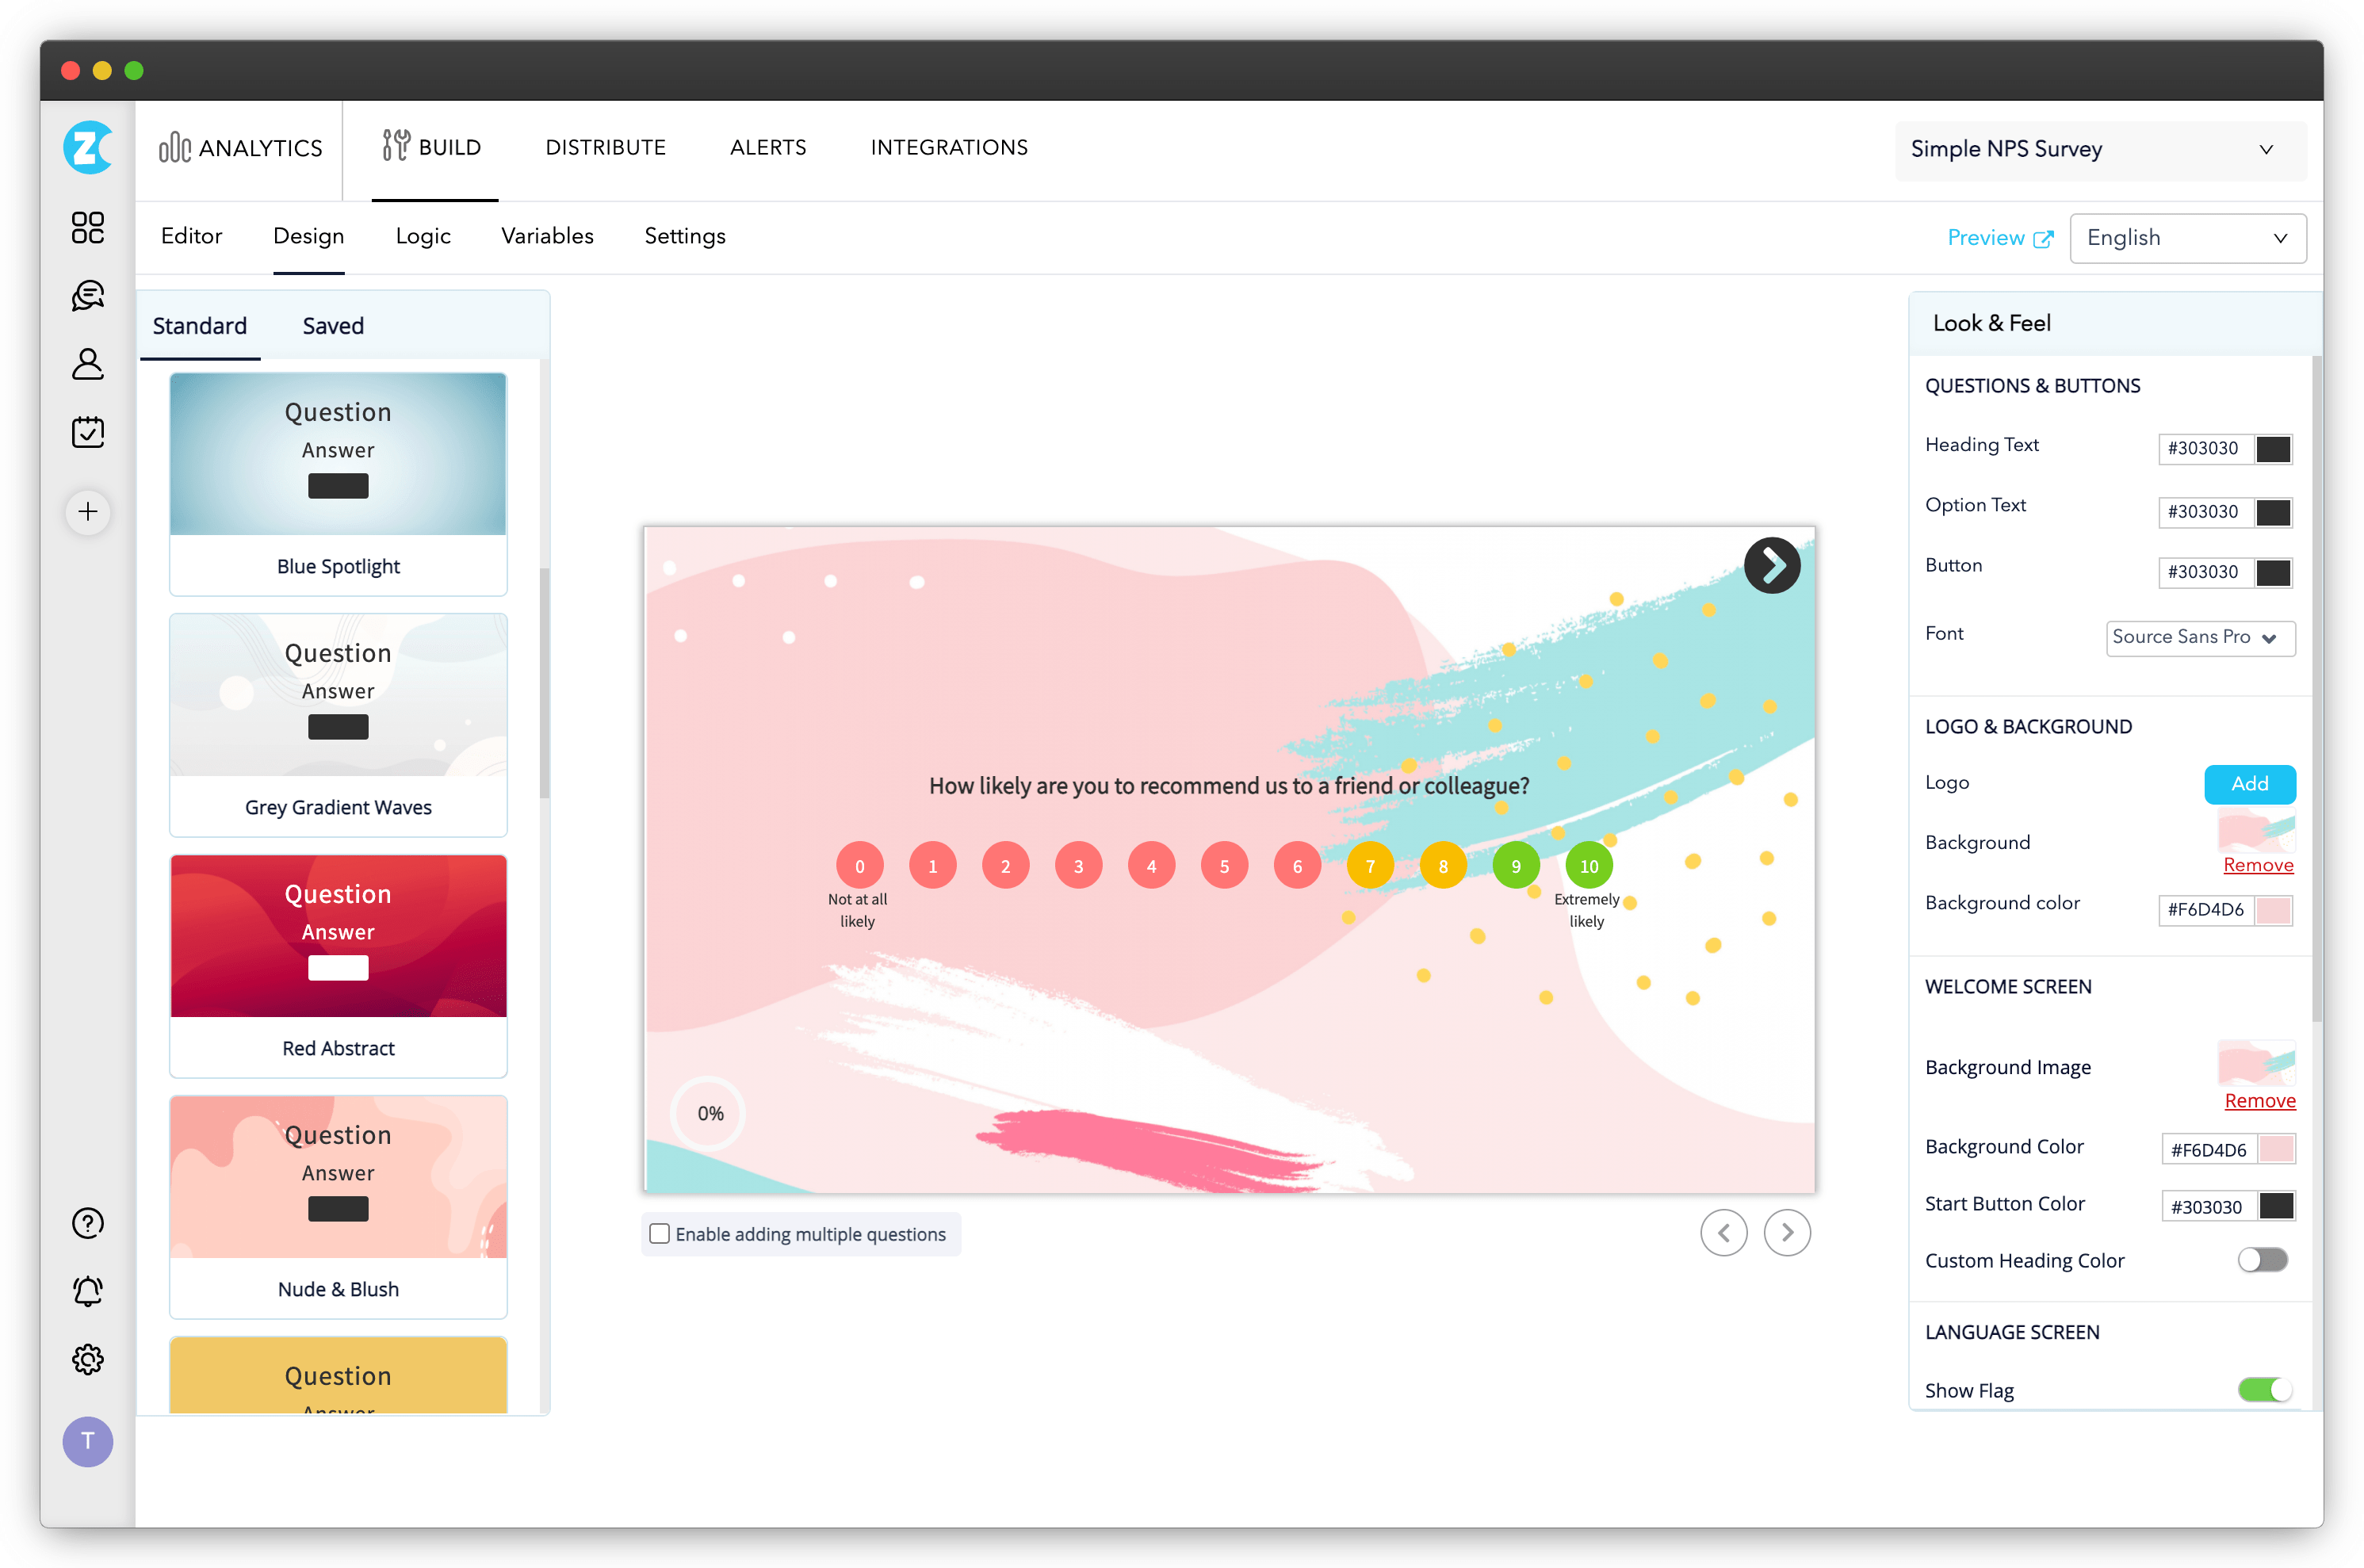
After adding your themes, grab your reader's attention and market your brand with your content by picking the correct font.
You can track your brands by adding logos in Zonka Feedback is a feature we already had. However, now we have designed our builder simpler for our customers to add logos, add background image or color, change the font style, change the font color, add personalized question/button color all at one go.
All this saves time and makes sure that your branding is similar on all the screens of your survey.
Thai Language Support
Talk to your customers in their language.
Avoid the chaos of creating separate surveys for each language. We at Zonka Feedback support 25+ languages already, and now, we've added the Thai language to our list.
Snapshot Report Enhancement
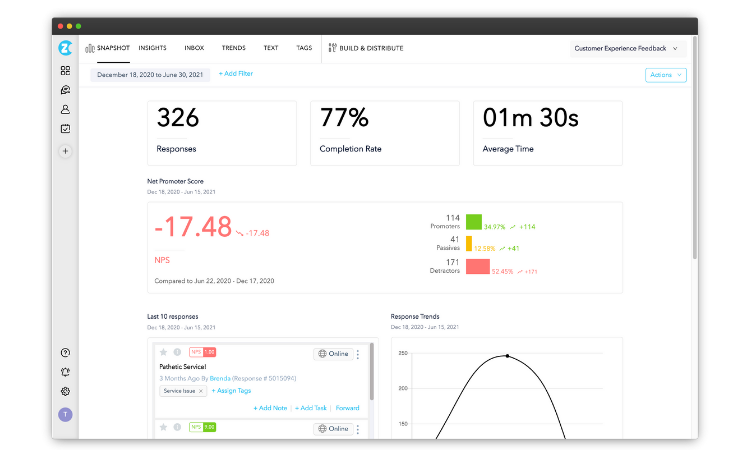
We have given the Snapshot Report a new coat of paint. Our new layout is easier and faster to gain deep insight into your survey responses.
We've simplified the Snapshot Report layout to make it easier to see your survey's overall responses, the average time taken to complete the survey, and the completion percentage.
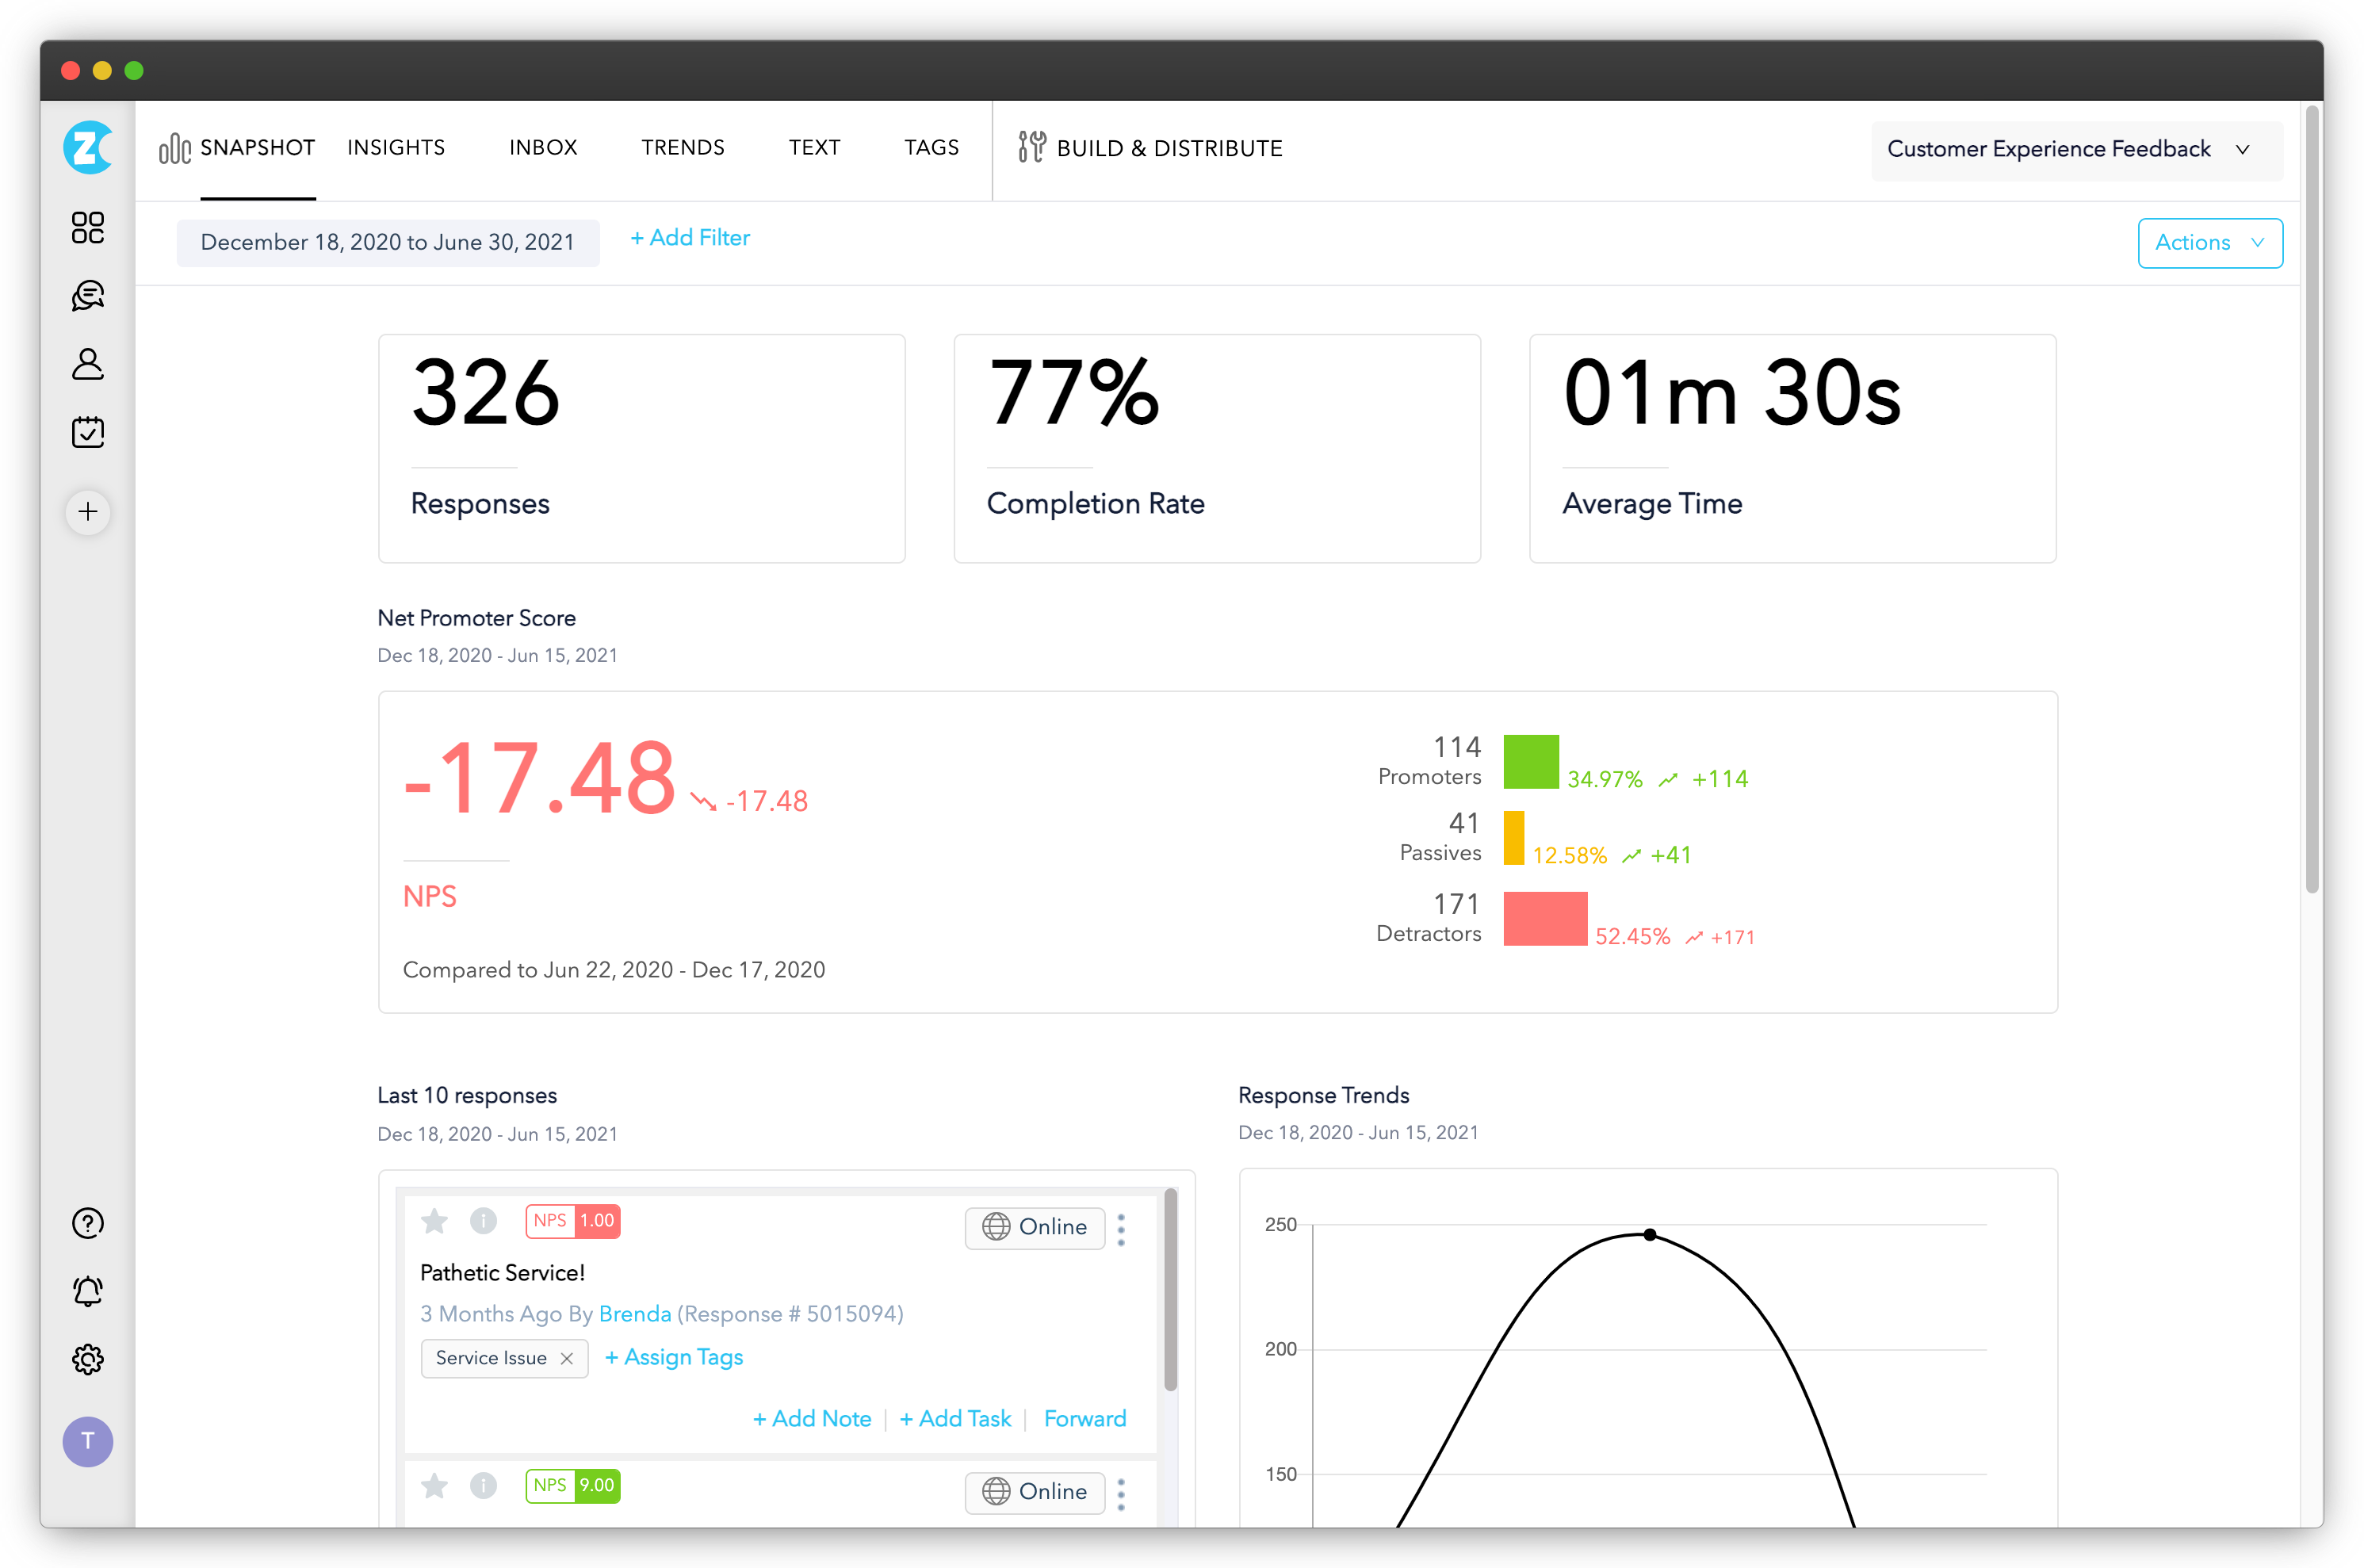
Some of the changes we've made are:
- Highlighted and aligned the overall responses, percentage of completion rate, and average time of the survey on the top.
- Total Responses - This shows the total number of responses collected against the survey.
- Completion Rate - This shows the overall completion % of the responses submitted for a survey within a selected period.
- Average Time - This shows the average time of filling up and submitting a survey across responses from a selected period.
- Organized and displayed your survey's NPS, CES, and CSAT scores.
- Reduced the chaos by grouping all your latest responses.
- Added response Trends map to take a look at data over time for a long-running survey and measure differences in perception and responses.
- Streamlined all your channels, their responses, and their corresponding score. Know which of your distribution channels is stronger and engages with most of your customers.
Experience our Simple but extemporized Snapshot Report. 🥳
You can now create, customize, distribute, and analyze surveys in a new, better way and improve your customer experience with the exciting features released.
Start your Customer Feedback Journey Today
Collect real-time, in-moment feedback at all touchpoints in customer journey and leverage feedback insights to transform customer experience.

.png)
.png)
.png)
.png)

