

.svg)
 Healthcare
 Finance
 Retail
 SaaS & Digital
 eCommerce
 Education
 Salesforce
  HubSpot
 Pipedrive
 Mailchimp
 Klaviyo
 Zendesk
  Intercom
 Freshdesk
 HelpScout
  Front
Front Jira
Jira Slack
Slack  MS Teams
 Zoom
Zoom Google Sheets
  Zapier
  Integrately
 Make
Make  Webhooks




 MS Teams



TL;DR
- Actionable insights in customer feedback are classified signals that tell you what's happening, who should care, and what to do next. Most theme dashboards deliver only the first.
- Feedback intelligence operates in two layers: detection (thematic, sentiment, intent, and entity analysis running in parallel on every response) and application (pre-classifying that output into operational categories like churn risk, suggestions, emerging issues, and advocacy).
- The gap between "we have themes" and "we know what to do" is not a data problem. It is a classification problem. Forty-one percent of organizations still sit at the most basic CX maturity stage because feedback data does not translate into operational decisions without a classification layer.
- Descriptive analysis tells you what happened. Predictive analysis tells you what's about to happen. Prescriptive analysis tells you what to do. Signal classification is the mechanism that moves a feedback program from descriptive to prescriptive.
- Five signal types close the classification gap: key drivers (with temporal state), churn signals (with recovery opportunities), mixed signals (score-sentiment contradictions), feedback queries (suggestions and questions), and praise and advocacy signals.
- The programs that survive the next budget review won't be the ones with the most dashboards. They'll be the ones that can point to a signal, show the action it triggered, and demonstrate the outcome.
Most CX teams aren't short on feedback. They're short on clarity about what to do with it.
The surveys go out. Responses come in. Themes get detected. Sentiment gets scored. The dashboard fills up with data that looks useful. And then the hardest question still sits unanswered: which of these 50 themes actually matters right now, and what should someone do about it?
That's not a data problem. It's a classification problem. And it's the reason Forrester's 2026 CX predictions describe most programs as "trapped in a stable but dysfunctional orbit, circling the black hole of measurement without meaning." The 15% of CX programs at risk aren't failing visibly. They're producing more reports, more dashboards, more real-time data, and none of it reveals which problems to solve, how to solve them, or why they matter to the business.
This piece unpacks what makes customer feedback insight actually actionable, why theme detection alone stops short, and what the structural shift from measurement to action looks like in practice.
The Theme Trap: Measurement That Looks Like Progress
Theme detection is the foundation of modern feedback analysis. AI reads thousands of open-text responses and clusters them into topics: delivery, pricing, customer service, product quality, app experience. That's genuinely valuable work that used to take weeks of manual coding.
But themes answer only one question: what are customers talking about?
They don't answer: Is this new? Is this growing? Is this a complaint or a suggestion? Is this customer at risk of leaving? Should the product team see this or the support team? Is this urgent or can it wait until next quarter?
Consider a theme labelled "delivery." That could mean a customer praising same-day shipping. It could mean someone threatening to cancel because their order arrived damaged. It could mean a feature request to add tracking to the app. All three cluster under the same theme. All three require completely different responses from completely different teams. And without classification, the person reading the dashboard has to figure out which is which, manually, for every theme, every week.
Gartner's research puts this in perspective: 41% of organizations still sit at the most basic, fragmented stage of CX maturity, with sharp drop-offs at every level above. The common thread isn't lack of data. It's that feedback data doesn't translate into operational decisions without an additional layer of classification. A complete CX maturity model names this plateau explicitly and shows the structural shift required at each level.
And that's where the concept of actionable insights enters. Not as a buzzword. As a structural requirement.
What Actually Makes an Insight "Actionable" in Customer Feedback
Actionable insights in customer feedback are classified signals that tell you what is happening, who should care, and what to do next. They go beyond theme detection and sentiment scoring to include temporal context (is this new or growing), operational routing (which team should act), and urgency classification (how quickly does this need attention).
The term "actionable insights" gets used loosely. Every analytics dashboard claims to deliver them. But strip away the marketing language and an insight is only actionable when it passes three tests:
| Test | What It Requires | What Most Dashboards Deliver |
| What's happening | A specific signal with context: "Delivery complaints increased 34% this month, concentrated in the Southeast, driven by late arrivals, damaged packaging, and missing items." | A theme label ("Delivery") and a sentiment score (-0.3) |
| Who should care | Enough classification to reach the right team: logistics, not marketing. Regional manager, not the CEO. | No routing. Whoever reads the dashboard decides who sees it. |
| What to do next | An operational classification: this is a process failure (fix fulfillment), a product gap (build tracking), or a people issue (retrain the team). | No classification. The response is left to the reader's interpretation. |
Most feedback analysis platforms deliver the first test reliably. Thematic analysis and sentiment scoring have gotten genuinely good. Where they stop is tests two and three. The classification that determines who should see it and what they should do with it is left to the person reading the dashboard.
Here's the thing. That person is usually a CX manager looking at 50 themes, all displayed with equal weight, trying to figure out which ones matter this week. The dashboard was never built to answer that question. It was built to display data. The step from display to decision is where most programs stall.
Two Layers of Feedback Intelligence: Detection vs. Application
Feedback intelligence that produces actionable insights operates in two distinct layers. Understanding the separation between them explains why most platforms stop short of actionability and what the structural fix looks like.
Layer 1: Detection
This is where most platforms live. Four types of analysis run on every response simultaneously, each answering a different question about the feedback:
-
Thematic analysis identifies what topics customers are talking about. Delivery. Pricing. Onboarding. App performance. These get organized into themes and sub-themes, giving you a structured map of customer conversation. The average open-text response contains 4.2 topics. Manual coding catches the primary theme. AI catches the other three, plus the signals hiding in the same sentence.
-
Sentiment analysis identifies how customers feel about each topic. Not just positive or negative at the response level, but per-theme sentiment. A customer might be happy with the product but frustrated with billing. Both signals need to be captured separately. A response that's "60% positive" is meaningless. A response where "product quality is praised but billing triggers frustration" is something two teams can act on.
-
Intent analysis identifies what the customer expects you to do. Are they complaining? Suggesting a feature? Asking a question? Praising something? Escalating an issue? Each intent type needs a different response. A feature request routed to support gets a canned "thanks for your feedback" reply. The same request routed to product gets added to the roadmap backlog. Research across 1M+ open-ended responses shows that 23% of feedback contains identifiable intent signals that carry direct routing information most programs never capture.
-
Entity recognition identifies which specific person, place, product, or touchpoint the feedback references. Not just "customer service was bad" but "Agent Sarah at the downtown location resolved my issue quickly." Entity mapping connects feedback to the specific part of the business it's about, turning generic complaints into location-specific, agent-specific, or product-specific intelligence.
These four capabilities are well established. Qualtrics, Medallia, Enterpret, Chattermill, SurveySparrow, and others all do some version of this. The outputs are themes, sentiment scores, intent labels, and entity tags. Individually, each is useful. Together, they form a complete detection layer.
And for most platforms, that's where it ends. The detection output gets displayed on a dashboard, and the classification work falls on whoever's reading it.
Layer 2: Application
This is where detection output becomes operational intelligence. Layer 2 takes the themes, sentiment, intent, and entity data from Layer 1 and pre-classifies it into categories that map directly to business decisions.
Instead of handing you 50 themes and a sentiment chart, Layer 2 sorts those themes into operational buckets. Each bucket answers a different question for a different team:
| Signal Category | What It Surfaces | Who Acts On It | Detection Inputs Used |
| Key Drivers | High-impact themes classified by temporal state: New (first time this period), Trending (gaining momentum), Emerging (small but growing), Positive, Negative | CX leadership, operations | Thematic + sentiment + volume change |
| Churn Signals | Themes carrying high churn risk, active complaints, and recovery opportunities (unhappy but salvageable customers) | Customer success, account management | Intent (complaint, escalation) + negative sentiment + urgency |
| Mixed Signals | Responses where the sentiment in the comment contradicts the score given: a promoter with frustrated language, or a detractor with positive comments | CX team, account owners | Sentiment + NPS/CSAT score comparison |
| Feedback Queries | Suggestions and questions/requests, separated from complaints and praise, grouped by theme and volume | Product team, support/knowledge base team | Intent classification (suggestion, question, request) |
| Praise & Advocacy | Themes generating genuine appreciation and active recommendations, strongest testimonial and referral signals | Marketing, RevOps | Intent (advocacy, recommendation) + positive sentiment |
Layer 2 doesn't require new data. It works on the same themes and sentiment that Layer 1 already detected. The difference is classification: sorting those themes into categories that tell specific teams what to do. That classification is what turns a theme dashboard into an operational tool. It's also what separates a platform that shows you data from one that tells you what the data means for your business.
From Descriptive to Prescriptive: Where Signal Classification Changes the Game
Signal classification in customer feedback is the process of automatically sorting detected themes and sub-themes into operational categories that indicate what action is needed, who should take it, and how urgent it is. It is the mechanism that moves feedback analysis from descriptive to prescriptive.
If you zoom out, the two-layer model maps onto a broader framework that every CX analytics program moves through.
-
Descriptive analysis answers: what happened? Themes tell you what customers talked about. Sentiment tells you how they felt. This is where most programs operate today, and it's genuinely valuable. But it's backward-looking. You're reading about last quarter's problems.
-
Predictive analysis answers: what's about to happen? Trending signals, emerging themes, and churn risk detection look at what's changing and project where it's going. A theme that appeared for the first time this month with negative sentiment and growing volume isn't just a data point. It's an early warning. The temporal classification (new, trending, emerging) built into signal categories is what makes this possible without building custom predictive models.
-
Prescriptive analysis answers: what should we do about it? This is where signal classification lives. When a theme is classified as a churn signal with recovery opportunities, that's prescriptive. It doesn't just tell you there's a problem. It tells you the problem is saveable, attaches the relevant customer data, and routes it to the team that can save it.
The shift from descriptive to prescriptive isn't about adding more sophisticated algorithms. It's about adding the application layer that connects detection output to business operations. Without it, you get what Forrester's Maxie Schmidt described: executives keep asking for more metrics, more real-time data. CX teams deliver exactly that. But what executives are really asking is: where do I need to go, and why?
Most CX programs reach the descriptive stage and plateau there, not because they can't move forward but because the infrastructure for the next stage, specifically the classification layer between analysis and action, was never built. The feedback intelligence framework names this gap and provides the structural model for closing it.
What This Looks Like When It Works (And When It Doesn't)
Take a restaurant chain running NPS surveys across 200 locations. Five hundred responses come in over a month.
Without signal classification: The dashboard shows 47 themes. A pie chart splits sentiment: 62% positive, 22% negative, 14% neutral. The top themes are "taste," "service," "atmosphere," "pricing," and "delivery." Each theme has a sentiment score. The CX team reviews the dashboard in a weekly meeting and discusses which themes seem important. They disagree. No one acts. The cycle repeats.
With signal classification: The same 47 themes are pre-sorted into operational categories before anyone opens the report:
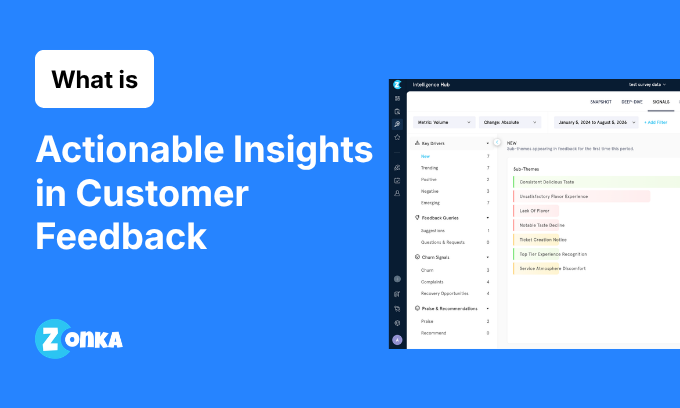
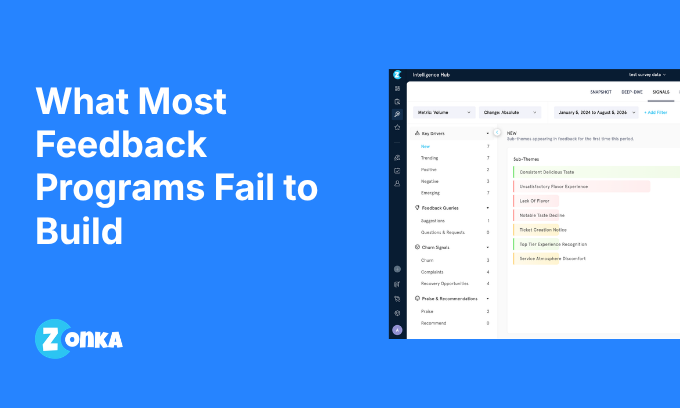
- "Consistent Delicious Taste" is a positive key driver. It's the strongest advocacy signal in the data. Marketing should feature it in campaigns. Protect it.
- "Service Atmosphere Discomfort" is a new negative signal that appeared for the first time this month. It wasn't in last month's data. Investigation priority: what changed?
- "Menu Variety" is tagged as a suggestion. Route to the product team. Twelve customers in the past month asked for the same thing.
- "Making Charges Too High" is a churn signal with medium urgency. Three responses in two weeks mention pricing frustration, all from the same region, all with negative sentiment intensity above the baseline. Route to the regional manager with the specific location data attached.
- One customer gave an NPS of 8 but wrote: "The making charges on all jewel pieces are too much. Very pissed about it. The staff was also not helpful at all." That's a mixed signal. The score looks decent. The language is furious. Without classification, it averages into the positive bucket. With classification, it's flagged for follow-up before the frustration becomes a cancellation.
The data was the same in both cases. The number of responses was the same. The themes were the same. The difference was the layer between the data and the next decision.
Why Most Teams Stay Stuck at Themes (And What It Actually Takes to Move)
Three structural barriers keep teams at the descriptive stage despite having the data to move forward.
-
Barrier 1: The analyst dependency. Enterprise platforms like Qualtrics and Medallia can technically deliver signal classification. But they require a dedicated analyst to build topic models, configure key driver widgets, set alert thresholds, and maintain taxonomies. Most mid-market teams don't have that person. The analysis capability exists in the tool. The human configuration required to activate it doesn't exist in the org chart.
-
Barrier 2: The two-tool tax. Teams using analytics-only platforms like Chattermill, Enterpret, or Thematic get sophisticated theme detection but no feedback collection. They run one tool for surveys and another for analysis, managing two integrations, two data pipelines, and two vendor relationships. The analytical depth is real. But the operational friction of moving insights from the analysis tool to the action tool creates a delay that erodes the value of real-time detection.
-
Barrier 3: The configuration assumption. Most platforms that offer signal detection ask you to define rules first. Flag a sub-theme when volume increases by 20%. Alert me when sentiment drops below a threshold. That approach works for teams who know what they're looking for. It doesn't work for the majority of CX, product, and support teams who need the analysis done for them. The signals they should be watching are precisely the ones they haven't thought to configure rules for, because they're new, unexpected, or emerging.
The structural fix for all three barriers is the same: a pre-built classification layer that works on top of existing detection, requires no configuration, and operates inside the same platform where feedback is collected. Zonka Feedback's AI Signals report inside Intelligence Hub is built around this two-layer model. Detection happens automatically through the Feedback Intelligence framework. Classification into five signal categories happens on top, without rules, thresholds, or an analyst.
But the principle isn't product-specific. Any team building a feedback program should be asking: does our analysis stop at detection, or does it carry through to classification? If you have themes and sentiment but your team still spends meetings debating what matters, the classification layer is what's missing.
The Dashboard Wasn't Built to Tell You What to Do
Most feedback programs were architected for measurement. Collect scores. Track trends. Report quarterly. That architecture served its purpose when the goal was to prove CX matters.
The goal has shifted. Proving CX matters is settled science. The question now is proving your CX program drives change. And that requires a different architecture: one where the analysis doesn't end at "here are your themes" but continues through to "here's what changed, here's who's at risk, and here's what to do next."
The programs that survive the next budget review won't be the ones with the most dashboards. They'll be the ones that can point to a signal, show the action it triggered, and demonstrate the outcome that followed. That's what makes insight actionable. Not the data. The classification that turns data into a decision someone can own.
Zonka Feedback's Intelligence Hub unifies feedback from surveys, support tickets, reviews, and chat into one analysis layer. AI agents detect themes, classify intent, map entities, and pre-sort everything into five signal categories: Key Drivers, Churn Signals, Mixed Signals, Feedback Queries, and Praise. No rules to configure. No analyst required. The classification happens automatically, and the Action Bar lets you email, Slack, create a task, or open a ticket directly from any signal, so the insight and the response happen on the same screen.

.svg)
.png)