.svg)
 Healthcare
 Finance
 Retail
 SaaS & Digital
 eCommerce
 Education

 Salesforce
  HubSpot
 Pipedrive
 Mailchimp
 Zendesk
  Freshdesk
 HelpScout
  Front
Front Slack
Slack  Zoom
Zoom Google Sheets
  Zapier
  Integrately
 Webhooks
  Blogs
Blogs Webinar
 Product Updates


In the current times, the landscape of business success is increasingly defined by how well you engage with your customers. Customer engagement is no longer just about transactions; it's about building lasting relationships that promote loyalty, drive repeat business, and turn customers into brand advocates. Studies have shown that about 87% of the brands have increased their investment in digital customer engagement despite economic uncertainty.
But how can you effectively measure and enhance this customer engagement?
This is where customer engagement metrics come into play. These metrics provide a clear, objective view of how your customers are interacting with your brand, offering invaluable insights into what strategies are working and what areas need improvement.
In this article, we'll delve into the top 16 customer engagement metrics you should track and measure to ensure your strategies are effective and driving the desired outcomes. Let's get started!
TL;DR
-
Customer engagement metrics are essentially quantifiable data points that tell you how interested and involved your customers are with your brand.
-
They help you understand the level of interest and involvement of your customers, which can inform strategies for improving customer relationships and driving growth.
-
Some common customer engagement metrics to track and measure includes Customer Lifetime Value, Net Promoter Score, Click-Through-Rate, Conversion Rate, Bounce Rate, Stickiness, Page Views among others.
-
Zonka Feedback offers you a platform for collecting, analyzing, and acting on customer feedback through various types of surveys like NPS, CSAT and CES across customer touchpoints. You can schedule a demo to get started with measuring customer engagement.
Measure Customer Experience with CX Metric Surveys🔥
Create surveys to measure customer engagement metrics like NPS, CSAT, and CES and get real-time feedback at every touchpoint.

Key Customer Engagement Metrics to Track
| Customer Engagement Metrics | Simple Formula | Use Case |
| Customer Lifetime Value | (ARPA x Gross Margin) x (Retention Rate ÷ 1+Discount Rate - Retention Rate) | Identify high-value customers, optimize marketing spend |
| Customer Satisfaction Score | (Number of Satisfied Customers ÷ Total Number of Survey Respondents)×100 | Gauge satisfaction after purchases, support interactions, etc. |
| Net Promoter Score | (% of Promoters) - (% of Detractors) | Identify loyal promoters and areas for improvement |
| Customer Churn Rate | (Lost Customers ÷ Total Customers at Start of Period) x 100 | Identify reasons for customer churn, and improve customer retention strategies |
| Customer Effort Score | (% Positive Effort Responses) - (% Negative Effort Responses) | Identify areas where customers struggle to interact with your brand |
| Click-Through Rate | (Clicks ÷ Impressions) x 100 | Gauge ad effectiveness, identify high-performing content |
| Conversion Rate | (Conversions ÷ Clicks) x 100 | Measure campaign success (purchases, signups, etc.), optimize landing pages |
| Bounce Rate | (Single-Page Sessions ÷ Total Sessions) x 100 | Identify user experience issues, improve website content |
| Stickiness | (Daily Active Users ÷ Monthly Active Users)×100 | Understand user engagement, analyze content effectiveness |
| Pageviews | Total number of times any page on your website is loaded | Track content popularity, identify user browsing behavior |
| Open Rates | (Opened Emails ÷ Total Sent Emails) x 100 | Measure email campaign performance, optimize subject lines |
| Pages Per Session | Total Pageviews ÷ Total Sessions | Analyze website navigation flow, identify user interest |
| Session Time | Total Session Duration ÷ Total Sessions | Understand user engagement level, analyze content depth |
| Video Completion Rate | (Video Completions ÷ Video Starts) x 100 | Measure video effectiveness, optimize video content |
| Content Shares | Number of times users share your content (articles, social media posts, etc.) on their own social networks |
Measure content reach and brand advocacy, identify high-performing content |
| User Activity | Various actions users take on your platform or website | Understand user behavior, identify areas for improvement |
Best Customer Engagement Metrics to Drive Business Success
Let us look at some essential engagement metrics to help you understand your customer base and adjust your marketing strategy to keep highly valued customers engaged in detail.
1. Customer Lifetime Value (CLV)
Customer Lifetime Value (CLV) is simply the value you get from each customer over the duration of their relationship with the company. If you successfully track and measure this key metric, you can make informed decisions to amplify engagement and retain profitable customer segments.
And, of course, investing more in customer segments with higher CLVs improves customer engagement, satisfaction, and loyalty by delivering more of what those customers value.
How to Calculate CLV?
Businesses often use advanced statistical techniques and machine-learning algorithms to calculate CLV based on historical data. Below is a simplified formula for the Predictive CLV
CLV = (ARPA x Gross Margin) x (Retention Rate ÷ 1 + Discount Rate - Retention Rate)
CLV is a great metric because it takes into account the following numbers:
-
ARPA (Average Revenue Per Account): The average revenue generated per user or account, typically measured over a specific period (monthly or annually).
-
Gross Margin: This represents the percentage of total revenue that is profit after accounting for the costs associated with the goods sold.
-
Retention Rate: The percentage of customers you retain without churn during a given period.
-
Discount Rate: The interest rate discounts future cash flows back to their present value, accounting for the time value of money.
So, for example, if:
-
ARPA = $100
-
Gross Margin= 50% (0.5)
-
Retention Rate=80% (0.8)
-
Discount Rate=10%(0.1)
Then the CLV= ( 100 X 0.5 ) X (0.8 / (1 + 0.1 - 0.8 )) = $133.33
There are other simplified formulas that you can use to calculate CLV like:
CLV = Lifetime Value x Profit Margin = (Average Value of Sale x Number of Transactions x Retention Time Period) x Profit Margin
Benefits of Measuring Customer Lifetime Value
Consider these reasons to measure customer lifetime value:
-
Product and Service Improvements: CLV analysis reveals high-value products/services, guiding product feedback and development to better meet customer needs.
-
Informed Marketing Strategies: CLV insights optimize marketing spend by highlighting the most effective channels.
-
Enhanced Customer Experience: The data obtained through CLV helps tailor superior service and personalized offers for high-value customers.
Tools to Keep Track of Customer Lifetime Value
Some tools to track customer engagement metrics of Customer Lifetime Value (CLV) include Kissmetrics, Google Analytics, HubSpot, Salesforce, and Zoho CRM. These tools offer features to track customer interactions, analyze purchasing behavior, and calculate CLV based on various metrics such as purchase history, average order value, and customer acquisition cost.
2. Customer Satisfaction Score (CSAT)
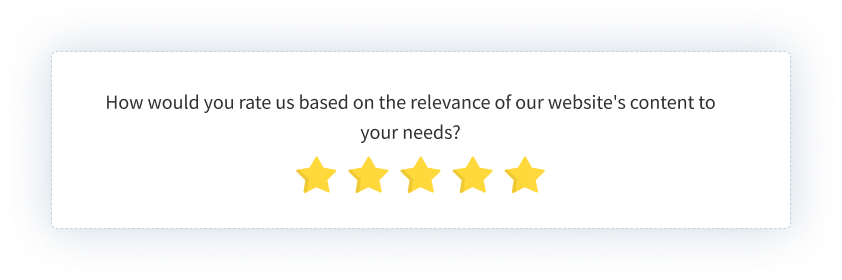
As the name indicates, the Customer Satisfaction Score (CSAT) measures customer satisfaction with a product, service, or specific interaction with a company.
It is usually a percentage derived from customers' responses to survey questions such as, "How satisfied were you with your experience?" The responses are usually on a scale ranging from very unsatisfied to very satisfied.
High CSAT scores are often directly correlated with higher customer engagement, retention rates and loyalty. Satisfied and loyal customers are more likely to return and recommend the business to others. Moreover, just like CLV, you can identify areas that require enhancement by segmenting CSAT scores by various factors such as demographics, product lines, or customer service touchpoints.
How to Calculate Customer Satisfaction Score?
The Customer Satisfaction Score (CSAT) is calculated by dividing the number of satisfied customers by the total number of survey respondents and then multiplying the result by 100.
CSAT = (Number of Satisfied Customers ÷ Total Number of Survey Respondents) × 100
To calculate CSAT score, let us take and example in which:
- Scale Range: 1-5 (1 being very unsatisfied and 5 very satisfied)
- Total Responses: 100
- Sum of Scores: 400 (Maximum should be 500 (5x100) if everyone is satisfied, and the minimum is 100 (1x100) if everyone is very unsatisfied)
Then, the CSAT Score can be calculated as follows:
CSAT = (Sum of Scores ÷ Total Responses x Highest Score) x 100 = (400 ÷ 100x 5) x 100 = 80%
The CSAT, in this case, is 80%, which shows a high customer satisfaction score, but there may still be room for improvement.
Benefits of Measuring Customer Satisfaction Score
Some benefits of keeping satisfied customers and measuring customer satisfaction scores include:
-
Actionable Insights: Direct customer feedback highlights what works and what needs improvement, guiding strategic decisions and operational enhancements.
-
Competitive Advantage: High CSAT scores differentiate a business from competitors, building a strong competitive edge.
-
Product and Service Improvement: Feedback identifies areas for product or service enhancements, driving innovation.

Tools for Measuring Customer Satisfaction Score
CSAT can be tracked with tools like Zonka Feedback, Google Forms for surveys, and CRM software like Salesforce. These tools can automate data collection and provide in-depth analytics, offering insights to drive key business decisions.
3. Net Promoter Score (NPS)
Net Promoter Score (NPS) is a customer engagement metric that measures customer loyalty and satisfaction. It is based on one simple question: Participants rate the likelihood of recommending the product to someone they know on a scale of 0 to 10.
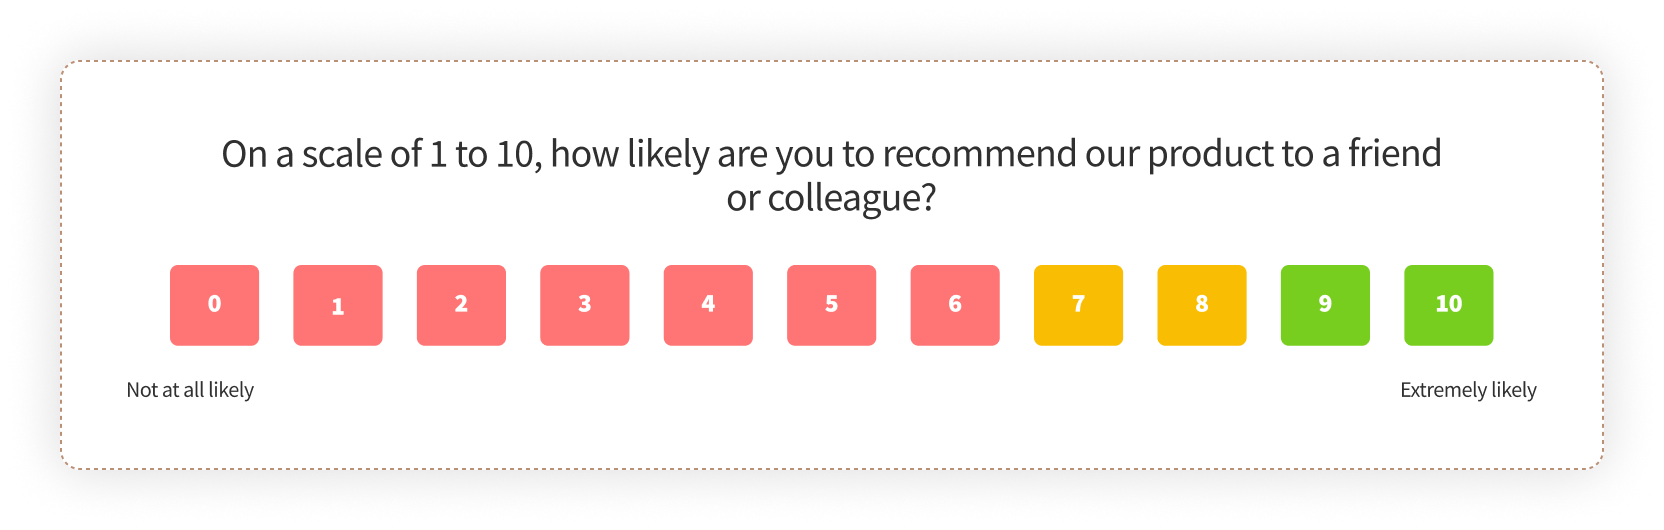
For example: "On a scale of 0 to 10, how likely are you to recommend our product or service to a friend or colleague?" Based on their responses, customers are categorized as Promoters (9-10 score), Passives (7-8 score), or Detractors (0-6 score).
The metric is easy to understand and implement and provides a clear measure that can be benchmarked over time or against competitors.
How to Calculate Net Promoter Score?
Net Promoter Score (NPS) is calculated by subtracting the percentage of detractors from the percentage of promoters.
NPS = (% of Promoters) - (% of Detractors)
To understand how NPS is calculated, let's say if a business collects the following responses:
-
Total Responses: 200
-
Promoters: 120
-
Passives: 50
-
Detractors: 30
The NPS can be calculated as follows:
NPS = (Promoters - Detracters ÷ Total Responses) x 100 = 120-30/200 x 100 = 45%
A more simplified way is to subtract the percentage of Detractors from that of Promoters, which would also have the same result: NPS= 60%-15%=45%
This score of 45% indicates positive customer sentiment and engagement, as more customers are promoters rather than detractors. This suggests good customer loyalty and the potential for positive word-of-mouth.
Benefits of Net Promoter Score
Net Promoter Score should be calculated as it helps with:
-
Loyalty Programs: Companies might develop or enhance loyalty programs targeting promoters to further increase their loyalty and advocacy and potentially convert detractors into promoters.
-
Segmentation and Targeting: NPS allows businesses to segment customers based on their loyalty levels, enabling more targeted marketing and engagement strategies.
-
Customer Satisfaction, Retention, and Growth: NPS is closely linked with higher customer satisfaction and retention rates, helps forecast growth through word-of-mouth referrals, and highlights areas needing enhancement to boost customer loyalty.
Tools for Tracking and Measuring Net Promoter Score
You can use survey tools such as Zonka Feedback, Qualtrics, SurveyMonkey to collect and analyze NPS data. These tools offer NPS surveys and features for tracking changes in NPS over time, segmenting customers based on their NPS scores, and identifying trends or patterns that can help improve customer satisfaction and loyalty.
4. Customer Churn Rate
Churn Rate is a metric that measures the percentage of customers who stop purchasing from a company during a given time frame. The churn rate is a key customer engagement metric indicator of customer retention and satisfaction.
Regular churn analysis can help companies identify the reasons behind customer departures and provide opportunities to increase customer engagement scores. It can also enhance customer satisfaction, improve retention, and drive better financial performance.

How to Calculate Customer Churn Rate?
Churn Rate is calculated by dividing the number of lost customers by the total number of customers at the start of the period, and then multiplying the result by 100.
Churn Rate = (Lost Customers ÷ Total Customers at Start of Period) x 100
For example, assume a business starts the quarter with 500 customers and loses 50 customers by the end of that period.
Churn Rate=(50/500)×100=10%
This calculation indicates that the business experienced a 10% churn rate during the quarter, meaning 10% of the starting customer base ended their services.
Getting feedback from departing customers can provide valuable insights into potential areas for improvement, helping reduce customer churn in the future.
Benefits of Calculating Customer Churn Rate
Here are some benefits of calculating customer churn rates:
-
Customer Retention Focus: Churn rate calculation emphasizes the importance of retaining existing customers, shifting focus from acquisition-only strategies to long-term customer satisfaction and loyalty.
-
Identifying At-Risk Customers: By tracking churn rate, businesses can identify customers who are likely to leave, allowing for proactive efforts to retain them through targeted retention campaigns or improved service.
-
Optimizing Customer Acquisition Cost (CAC): Retaining customers is often more cost-effective than acquiring new ones. Monitoring churn rates helps in understanding the true cost of acquiring and retaining customers.
Tools for Tracking and Measuring Churn Rate
Some popular tools for tracking and measuring churn rates include Zendesk, HubSpot, Salesforce, Intercom, Google Analytics, and ChurnZero. These tools offer a range of features such as customer support and engagement tools, CRM solutions, analytics for tracking user behavior, and automated messaging for targeted communications.
5. Customer Effort Score (CES)
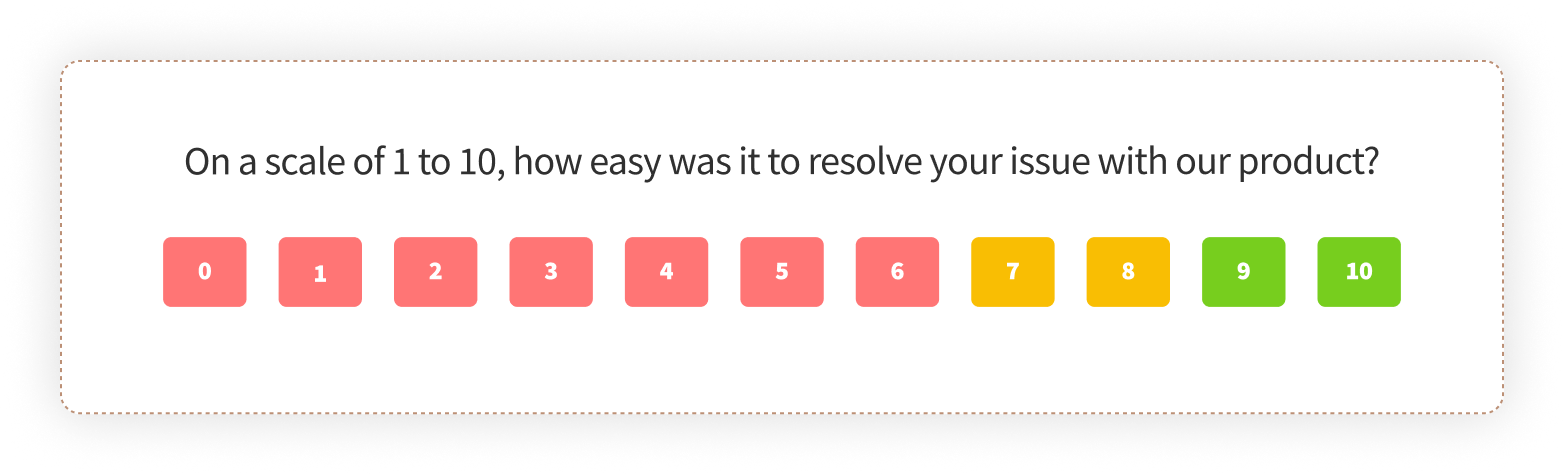
Customer Effort Score (CES) is a metric that measures the ease with which customers can complete specific interactions with a company, such as making a purchase, resolving a service issue, or getting a question answered.
It typically asks customers to rate the ease of their experience on a scale from "very easy" to "very difficult" and helps to improve customer experience and reduce churn rates.
How to Calculate Customer Effort Score?
The CES is typically calculated using the average of all customer effort scores collected. The formula is:
Customer Effort Score = (% Positive Effort Responses) - (% Negative Effort Responses)
Let's say you collected the following responses from a survey of 100 customers:
-
Total Scores Summed: 500
-
Total Responses: 100
Then, the CES would be calculated as CES=500/100=5
On average, customers rated their effort as 5 on a scale from 1 to 7, where 1 is very difficult, and 7 is very easy.
Benefits of Calculating Customer Effort Score
You should consider these reasons why customer effort score matters for your business:
-
Detect Friction Points: By analyzing individual low scores, a business can identify specific stages in the customer journey that may be causing friction.
-
Comparative Analysis: Comparing CES scores before and after implementing changes can directly show whether new strategies or tools have reduced customer effort.
-
Customer Segmentation: Higher effort scores in particular segments can indicate a need for segment-specific solutions to improve experiences and engagement for specific customer groups.
Tools for Tracking and Measuring CES
Modern survey tools and platforms, such as Zonka Feedback, Qualtrics, and SurveyMonkey, or in-built survey features in CRM systems like Salesforce, can automate the collection and analysis of CES data.
6. Click-Through Rate (CTR)
Click-Through Rate (CTR) is a fundamental metric for measuring the effectiveness of online advertising campaigns, emails, and digital marketing content.
It measures the ratio of users who click on a specific link to the number of total users who view the page, email, or advertisement. CTR is a key indicator of how well your keywords, ads, or email campaigns engage potential and existing customers.
How to Calculate Click-Through Rate?
CTR is calculated by dividing the number of clicks an ad receives by the number of times the ad is shown (impressions), multiplied by 100 to convert it into a percentage.
CTR = (Number of Clicks ÷ Number of Impressions) x 100
For emails, for example, you can use the number of delivered emails in the denominator instead of the number of impressions.
For example, let us assume an email receives 200 clicks from 5,000 delivered emails:
CTR=(200/5000)×100=4%
This calculation results in a CTR of 4%, which means that 4% of the people who received the email clicked on it.
Benefits of Using Click-Through-Rate
Here's why CTR is important:
-
Performance Indicator: CTR helps determine an advertisement's or marketing campaign's success by showing how appealing and compelling an ad is to its target audience.
-
A/B Testing: Marketers can use CTR to test different versions of ads, emails, or landing pages to determine which version generates the highest engagement and use that version for future campaigns.
-
Target Audience Refinement: Analyzing the CTR can help marketers refine their target audience or optimize the placement and content of ads to match viewer preferences and behaviors better.
-
Budget Allocation: By understanding which ads or campaigns have higher CTRs, businesses can allocate their budget more effectively toward high-performing ads to maximize campaign results.
Tools for Tracking and Analysing CTR
Digital marketing platforms such as Google Ads, Facebook Ads Manager, and email marketing tools like GetResponse and Mailchimp provide extensive analytics on CTR. These platforms offer detailed reports and real-time data, allowing marketers to monitor campaign performance and make data-driven decisions.
7. Conversion Rate
Conversion Rate is a key metric to evaluate the effectiveness of specific actions intended to engage customers and push them to complete a desired action. This can be a purchase, a sign-up, or any other key performance indicator (KPI) that a business might prioritize.
The conversion rate from engagement efforts is crucial as it measures the effectiveness of strategies in converting engaged users into actions that meet business goals. It also quantifies the ROI from marketing and engagement initiatives, helping in strategic decision-making by optimizing resource allocation based on what drives conversions.
How to Calculate Conversion Rate?
Conversion rate is calculated by dividing the number of users who have taken a desired action by the total number of users targeted by the engagement effort, then multiplying by 100 to get a percentage.
Conversion Rate = (Number of Conversions/Total Number of Engaged Users) × 100
For example, suppose an online campaign aimed at getting users to download a guide has:
-
Engaged Users: 10,000
-
Conversions (downloads): 500
Then, the Conversion Rate would be calculated as Conversion Rate=(500/10,000)×100=5%
This means that 5% of the users engaged by the campaign converted by downloading the guide.
Benefits of Measuring Conversion Rate
Here are some reasons why you must measure conversion rates:
-
Optimizing Campaigns: Analyzing the conversion rates of different campaigns allows marketers to identify the most effective techniques and messaging for engaging their audience.
-
Improving User Experience: Low conversion rates may indicate a problematic user experience or unclear call-to-action.
-
A/B Testing: Conversion rates are often used to compare the effectiveness of different versions of webpages, ads, or user flows in an A/B testing scenario to determine which variations perform the best.
Tools to Measure Conversion Rate
Digital marketing platforms such as Google Analytics, Adobe Analytics, and HubSpot provide extensive tools to track conversion rates. These platforms can integrate data from various engagement channels to help you understand how different efforts drive conversions.
8. Bounce Rate
Bounce Rate is an important metric in digital analytics, especially regarding engagement, and website performance. It measures the percentage of visitors who enter a site and then leave ("bounce") rather than continuing to view other pages within the same site. A bounce is essentially a single-page session on your site.
Bounce rate provides insight into user engagement and website effectiveness, indicating if entrance pages are relevant and if the user experience is satisfactory. High bounce rates may signal the need for content improvement or better alignment with marketing expectations.
How to Calculate Bounce Rate?
The bounce rate is calculated by dividing the number of single-page sessions by the total number of sessions on the site, then multiplying by 100 to express the result as a percentage.
Bounce Rate = (Number of Single Page Sessions ÷ Total Sessions) x 100
For example, if a website receives 1,000 total sessions, and 300 of these are single-page sessions (the user left the site from the entrance page without interacting with the page):
Bounce Rate=(300/1000)×100=30%
This result indicates a 30% bounce rate, meaning 30% of all sessions on the site ended after viewing just one page.
Benefits of Measuring Bounce Rate
Here are some reasons why you must measure bounce rate as one of the customer engagement metrics:
-
Website Optimization: By identifying pages with high bounce rates, webmasters can investigate potential causes (such as poor content, slow loading times, or bad user experience) and make appropriate optimizations.
-
Improving User Experience: Enhancements based on bounce rate analysis can include clearer calls to action, more engaging content, faster page load times, and improved navigation.
-
Conversion Rate Improvement: Lowering the bounce rate on key pages can lead to higher engagement and potentially more conversions as users stay longer and interact more with the site.
Tools for Measuring Bounce Rate
Web analytics tools like Google Analytics, Hotjar, and Clicky provide insights about bounce rates across various dimensions, such as traffic source, device type, and geographical location. These tools help webmasters and digital marketers analyze bounce rate data in context, allowing for more targeted interventions.
9. Stickiness
Stickiness is a key metric for measuring user engagement and retention on digital platforms, particularly websites and mobile applications. It refers to a platform's ability to attract and retain users over time, encouraging them to visit frequently and engage more deeply with the content or services provided.
By understanding and enhancing a platform's stickiness, businesses can ensure that their user base remains active and engaged, which is vital for long-term success. Regularly analyzing this metric helps align product offerings with user expectations, boosting user satisfaction and loyalty.
How to Calculate Stickiness?
Stickiness can be measured by comparing the Daily Active Users (DAU) and Monthly Active Users (MAU) through the following formula:
Stickiness = (DAU ÷ MAU) x 100
This formula provides a percentage that reflects the average daily engagement compared to the monthly engagement base.
For example, suppose a mobile app has:
-
DAU (Daily Active Users): 20,000
-
MAU (Monthly Active Users): 100,000
Then, the Stickiness would be calculated as Stickiness=(20,000/100,000)×100=20%
This means that, on average, 20% of the monthly active users engage with the app daily, indicating moderate user engagement and retention.
Benefits of Measuring Stickiness
Consider these reasons why you must measure stickiness:
-
Product Improvements: By monitoring stickiness, companies can identify whether new features or content effectively engages users. A decline in stickiness might indicate a need to review recent changes or user feedback.
-
Marketing Effectiveness: High stickiness indicates that marketing efforts attract and retain users successfully. It helps fine-tune marketing strategies to target the most responsive user segments.
-
Community Building: Platforms with social features can measure stickiness as a measure of community engagement and health, which is crucial for platforms that depend on user-generated content.
Tools for Measuring Stickiness
Analytics platforms like Google Analytics, Mixpanel, and Amplitude offer detailed insights into user engagement metrics such as DAU and MAU, which are essential for calculating stickiness. These tools help visualize trends over time and can segment data by user demographics or behavior patterns to provide deeper insights into what drives engagement.
10. Pageviews
Pageviews is a key metric in web analytics that counts the total number of pages viewed on a website. It includes repeated views of a single page by the same user and provides a basic measure of a website's overall traffic and user engagement level.
This metric serves as a stepping stone for deeper analysis into user behavior, website effectiveness, and content strategy alignment with user needs, all crucial for enhancing website and customer engagement strategies and achieving business objectives.
Pageviews are directly recorded by web analytics tools and do not require a calculation per se. Each time a page is loaded by a user's browser, the analytics tracking code counts that as a pageview.
Benefits of Tracking Pageviews
Here are some reasons why you should consider monitoring pageviews:
-
Content Strategy Development: Analyzing pageviews can help content creators understand trends and user interests, allowing them to create future content that matches audience preferences.
-
Website Layout Optimization: High pageviews on specific pages might encourage a business to optimize these pages further, perhaps by improving calls to action or placing important promotional content on these pages.
-
Performance Benchmarking: Tracking pageview changes over time can help measure the effectiveness of SEO efforts, marketing campaigns, and site modifications.
Tools for Tracking Pageviews
Web analytics services such as Google Analytics, Adobe Analytics, and similar platforms automatically track pageviews. These tools offer detailed reports that show total pageviews and break down the data by source, geography, device, and other dimensions to help you understand traffic patterns.
11. Open Rates
Open Rates are a key customer engagement metric primarily used in email marketing to measure the percentage of recipients who open a given email campaign. This metric is pivotal in assessing your email content's initial impact and relevance to the target audience.
How to Calculate Open Rates?
Open Rates are calculated by dividing the number of emails opened by the number of emails delivered (excluding those that bounced) and then multiplying by 100 to convert it to a percentage.
Open Rate = (Opened Emails ÷ Total Sent Emails) x 100
Suppose an email campaign is sent to 10,000 recipients, and 1,000 emails are opened:
Open Rate = (1,000/10,000)×100 = 10%
This means that 10% of the recipients opened the email, which can be interpreted based on the industry average open rates to determine the campaign's relative success.
Benefits of Tracking Open Rates
Here are some benefits of tracking open rates for which you must consider these engagement metrics to measure :
-
Enhanced Email Marketing Effectiveness: Actively tracking and optimizing open rates can significantly improve the effectiveness of email marketing campaigns by ensuring emails reach inboxes and capture recipients' attention, leading to higher engagement and meeting overall marketing objectives.
-
Optimizing Email Content: Monitoring open rates can help improve email content, subject lines, and send timing. For instance, A/B testing different subject lines can identify more effective approaches.
-
Target Audience Adjustment: Analysis of open rates by demographic or customer behavior can help marketers adjust their targeting strategies to focus on the most responsive segments.
Tools for Tracking Open Rates
Email marketing platforms like Mailchimp, Constant Contact, and HubSpot provide robust analytics features that track open rates and other pertinent metrics like click-through rates and conversions. These platforms offer insights into campaign performance and allow for detailed segmentation and A/B testing to optimize open rates.
12. Pages Per Session
Pages per session is an essential metric used in web analytics to measure the average number of pages viewed during a session on a website. This metric helps measure user engagement and interest by indicating how deeply users interact with the site's content.
How to Calculate Pages Per Session?
Pages Per Session are calculated by dividing the total number of page views by the total number of sessions.
Pages Per Session = Total Pageviews ÷ Total Sessions
If a website receives 5,000 page views and there are 1,250 sessions in a given period:
Pages Per Session=5000/1250=4 Pages
This result means that, on average, visitors view 4 pages each time they visit the site. This indicates a relatively high level of engagement, assuming the context supports it (such as a content-rich site).
Benefits of Calculating Pages Per Session
Consider these reasons why you must consider pages per session as an important customer engagement metrics.
-
Insight into User Interaction: Monitoring Pages Per Session provides valuable insights into how users engage with the website, helping businesses understand user behavior and preferences better.
-
Content Engagement Enhancement: Pages Per Session is crucial for developing strategies to enhance content engagement, as it indicates how many pages users typically view in a single session, guiding content creation and placement decisions.
-
Conversion Rate Enhancement: Increasing the number of pages a user views can also increase the chances of conversion. By exposing users to more calls-to-action and informational content, marketers can improve conversion rates and drive desired actions from their audience.
Tools for Tracking Pages Per Session
Web analytics tools such as Google Analytics, Adobe Analytics, and Matomo usually provide insights about pages per session and related metrics such as bounce rate, average session duration, and user flow through the site. These tools allow webmasters and digital marketers to analyze user behavior in detail and identify trends or areas for improvement.
13. Session Time
Session Time, also known as "Average Session Duration," is an analytical metric used to measure the total time spent by users in a session on a website. This metric is vital for assessing user engagement, the effectiveness of website content, and the overall user experience the site provides.
How to Calculate Session Time?
Session Time is typically calculated by tracking the start and end of a user's interaction on the site and averaging this duration across all sessions.
Average Session Duration = Total Session Duration ÷ Total Sessions
If users have engaged with a website for over 200 sessions, and the combined total duration of these sessions is 10,000 minutes:
Average Session Duration=10000/200=50 minutes per session
This means that, on average, a user spends 50 minutes in a session on the website, indicating good user engagement and content effectiveness.
Benefits of Calculating Session Time
Here are some reasons why you must calculate session time as a customer engagement metrics for sustained business growth
-
Improving Content Strategy: If session times are shorter than expected, it may indicate that the content is not engaging enough or does not meet the visitor's expectations.
-
Enhancing Site Usability: Longer session times can indicate that users find the website easy to interact with. Insights from session duration can guide improvements in site design and functionality.
-
Boosting SEO and Conversion Rates: Search engines consider user engagement a ranking factor. Sites with longer session times might be seen as offering more value, potentially improving SEO rankings. Moreover, increased engagement can lead to higher conversion rates as users interact more with calls to action.
Tools for Tracking Session Time
Web analytics platforms such as GA4, provide detailed tracking and reporting of session times and related metrics like bounce rate, pages per session, and user demographics. You can also use Google Analytics, Adobe Analytics, and Woopra. These platforms enable businesses to analyze data in real-time and adjust their web strategies based on user behavior insights.
14. Video Completion Rate
Video Completion Rate is a key engagement metric used to measure the percentage of viewers who watch a video from start to finish. It is essential to evaluate the effectiveness of video content in maintaining viewer engagement and effectively delivering messages or calls to action.
How to Calculate Video Completion Rate?
Video Completion Rate is calculated by dividing the number of viewers who watched the video until the end by the total number of viewers who started watching the video, then multiplying by 100 to convert it to a percentage.
Video Completion Rate = (Number of Complete Views ÷ Total Views) x 100
Suppose a video on a platform has been started by 1,000 viewers and 700 of these viewers watch it to completion:
Video Completion Rate=(700/1000)×100=70%
This result indicates a 70% completion rate, suggesting that most viewers found the video engaging enough to watch it through to the end.
Benefits of Calculating Video Completion Rate
Here are some benefits of calculating video completion rates:
-
Content Strategy Enhancement: Insights from video completion rates can guide future video content development, helping match viewer preferences and increase engagement.
-
Marketing Insights: High completion rates can indicate effective video marketing content. Marketers can use this data to optimize the placement of calls to action, ensuring they appear at points that maximize viewer retention.
-
Audience Understanding: Analyzing completion rates across different demographic segments can help content creators understand which parts of their audience are most engaged, allowing for more targeted content creation.
Tools for Measuring Video Completion Rate
Video analytics tools like YouTube Analytics, Vimeo Analytics, and specialized software integrated into content management systems track video completion rates. These tools offer detailed breakdowns by viewer demographics, playback devices, and other key metrics used to understand how different audiences interact with video content thoroughly.
15. Content Shares
Content Shares measure the frequency with which content is shared by users across various platforms, particularly social media. This metric helps measure customer engagement by assessing the virality, relevance, and appeal of content among audiences, indicating how well it encourages users to spread the word.
How to Calculate Content Shares?
Content Shares are typically tracked by counting the total number of times content is shared across various platforms. This can include shares on social media, reposts, email forwards, and other forms of content redistribution.
For example, if a blog post, video, or infographic is shared:
-
Total Shares on Social Media: 300
-
Email Forwards: 50
-
Reposts on Other Blogs: 25
The total content shares would be: Total Content Shares=300+50+25=375
This total indicates the content was shared 375 times across different platforms, reflecting its ability to engage the audience.
Benefits of Calculating Content Shares
Here are some benefits of calculating content shares:
-
Content Strategy Optimization: Analyzing which types of content are shared most frequently can help make an effective content strategy and plan content that better matches audience preferences and maximizes shareability.
-
Influencer and Audience Insights: Content shares can provide insights into who shares the content and their potential influence, which can be crucial for targeting marketing efforts and building relationships with key influencers.
-
Feedback and Improvement: High shares on specific topics or formats can guide content creators on what works well, while low shares might highlight areas needing improvement or adjustment.
Tools to Track Content Shares
Many digital marketing tools and platforms, including GA4, Hootsuite, BuzzSumo, and social media native analytics (such as Facebook Insights and Twitter Analytics), offer detailed tracking and reporting on content shares. These tools can segment data by demographic, location, and behavior to provide deeper insights into how different audiences interact with content.
16. User Activity
User Activity measures users' engagement and interaction with a platform, such as a website, mobile app, or software. This metric tracks user actions, such as clicks, logins, page views, and other interactions indicating active participation.
How to Calculate User Activity?
User Activity is typically calculated by aggregating various interaction metrics such as:
-
Number of logins or sessions
-
Total clicks or interactions within the platform
-
Frequency and duration of activity sessions
For example, consider a mobile app with the following user interactions over a month:
-
Total Sessions: 15,000
-
Total Clicks: 45,000
-
Total Active Time: 30,000 minutes
Depending on the specific analysis goals, an index of User Activity could be created by combining these interactions into a single measure or averaging them.
Benefits of Calculating User Activity
Some benefits of calculating user activity involve:
-
Improvement of User Experience (UX): Understanding which features drive the most interaction and which are underused can help UX designers and developers improve the overall user experience.
-
Customization and Personalization: Data on user activity can help improve the user experience, providing personalized content or feature recommendations based on user preferences.
-
Marketing and Communication Strategies: Marketing campaigns and communications can more effectively target active users, potentially increasing conversion rates and enhancing user engagement.
Tools to Track User Activity
Google Analytics, Adobe Analytics, Mixpanel, and Hotjar are comprehensive solutions for tracking user activity and analyzing user behavior on websites and applications.
Conclusion
Tracking and measuring customer engagement metrics plays an important role in understanding how customers interact with the business and helping to tune marketing strategies. Some popular and important customer engagement metrics include CLV (Customer Lifetime Value), CSAT (Customer Satisfaction Score), and NPS (Net Promoter Score).
Advanced analytics tools like Adobe Analytics and Google Analytics 360 and customer experience management tools like Zonka Feedback can help you create data-driven strategies and make informed decisions, leading to improved customer satisfaction and financial performance.
Zonka Feedback offers a range of features like creating and distributing surveys across various channels to track key engagement metrics such as NPS, CSAT, and CES. You can monitor responses in real-time and identify areas for improvement quickly. It also offers AI features like sentiment analysis and text analysis, workflow automation, and collaborative features empowering its ability to gauge engagement levels.
Schedule a demo and get started with measuring customer engagement metrics effectively!


.png)