


.svg)
 Healthcare
 Finance
 Retail
 SaaS & Digital
 eCommerce
 Education

 Salesforce
  HubSpot
 Pipedrive
 Mailchimp
 Zendesk
  Freshdesk
 HelpScout
  Front
Front Slack
Slack  Zoom
Zoom Google Sheets
  Zapier
  Integrately
 Webhooks
  Blogs
Blogs Webinar
 Product Updates


How good is your customer service, and how do you measure it accurately? Is performance judged by internal assumptions, feedback from your support team, or data directly from your customers?
Customer service has evolved significantly over the years. What once focused on call centers and reactive support has now become a critical part of delivering a consistent, memorable customer experience. Modern helpdesk tools help streamline customer service operations by managing tickets efficiently, assigning agents, and improving response and resolution times.
However, delivering great customer service requires more than tools alone. Businesses need clear, reliable data to measure agent performance, helpdesk efficiency, and customer satisfaction. That is where customer service metrics play a key role. This curated list of essential customer service metrics for 2026 helps you focus on the most impactful indicators to track, analyze, and improve customer experience without overwhelming your teams with unnecessary data.
TL;DR
- Customer service metrics help businesses measure how effectively their support teams respond to, resolve, and satisfy customer needs across channels. They provide data-driven insights into agent performance, helpdesk efficiency, and overall customer experience.
- With customer expectations continuing to rise in 2026, relying on assumptions or isolated feedback is no longer enough. Teams need clear, actionable customer service metrics to identify gaps, improve service quality, and make informed decisions that drive customer satisfaction and retention.
- This blog curates the most important customer service metrics to track in 2026, covering operational metrics like response and resolution times, experience metrics like CSAT, CES, and NPS, and performance indicators that help balance efficiency with customer satisfaction.
- Rather than tracking every available metric, this guide helps you focus on the metrics that matter most, explains how to measure them, and highlights how they contribute to better customer service outcomes.
- Zonka Feedback helps teams track key customer service metrics in real time using customer surveys, agent feedback, automated workflows, and role-based dashboards. You can schedule a demo or request for free trial activation to see how Zonka Feedback enables data-driven customer service measurement and continuous experience improvement.
Measure Customer Service Performance
Improve your customer service and grow your business with real-time feedback

Customer Service vs Customer Support: What’s the Difference?
A lot of businesses confuse the term Customer Service with customer support. Although they might sound similar, there are some differences in their functioning that you should know of.
Customer Service is a term used for referring to the interaction of a company with its customer before, during, and post-purchase of a product/service. The sole motive is to enhance the customer’s experience and strengthen their relationship with your brand.
Customer Support, on the other hand, comes under the umbrella of Customer Service and refers to the assistance provided to customers post product/service purchase. This assistance may include troubleshooting, installation, or other issues that might occur during product/service usage. It’s commonly called technical support. For example, an online IRS EIN Tax ID service provider provide consulting service during the firm formulation and then he will provide technical support if their client face issues during the taxes deposition, report submission, tax deductions for LLC etc. during the report submission to their local regulatory bodies.
In the intricate tapestry of corporate financial landscapes, executive compensation consulting firms emerge as architects of bespoke remuneration strategies, crafting intricate frameworks that transcend the conventional boundaries of salary structures. These firms delve into the labyrinth of executive incentives, sculpting compensation packages that dance on the fine line between motivation and fiscal responsibility.
Both Customer Service and customer support fall under the Customer Experience.
What are Customer Service Metrics?
Customer Service Metrics are indicators that provide a data-specific picture of your customer support processes and the satisfaction of customers with your business.
Measuring the right Customer Service Metrics can help you in quantifying your support agents’ performance and make customer-centric decisions to improve customer engagement. The metrics can help you get answers to important questions like:
- What is the experience of your customers with your products/services?
- How responsive is your Customer Service team?
- How much effort do customers put to use your products/services?
- Are your customers satisfied with the channel they use to communicate with your business?
- Are you doing enough to retain customers and their loyalty?
In this article, we’ll be discussing the key Customer Service Metrics you should be measuring right now to amplify your team’s performance and help them achieve their maximum potential. We have divided these customer service survey metrics into two segments - Operational and Customer Experience.
What are the Types of Customer Service Metrics?
Customer service metrics can be broadly categorized based on what they measure and how they are used. In this guide, we focus on two core types of customer service metrics: Operational Customer Service Metrics, which measure the efficiency and performance of support teams, and Customer Experience Metrics, which capture customer satisfaction, sentiment, and loyalty. Understanding the difference between these two types helps businesses track the right metrics and improve both service efficiency and overall customer experience.
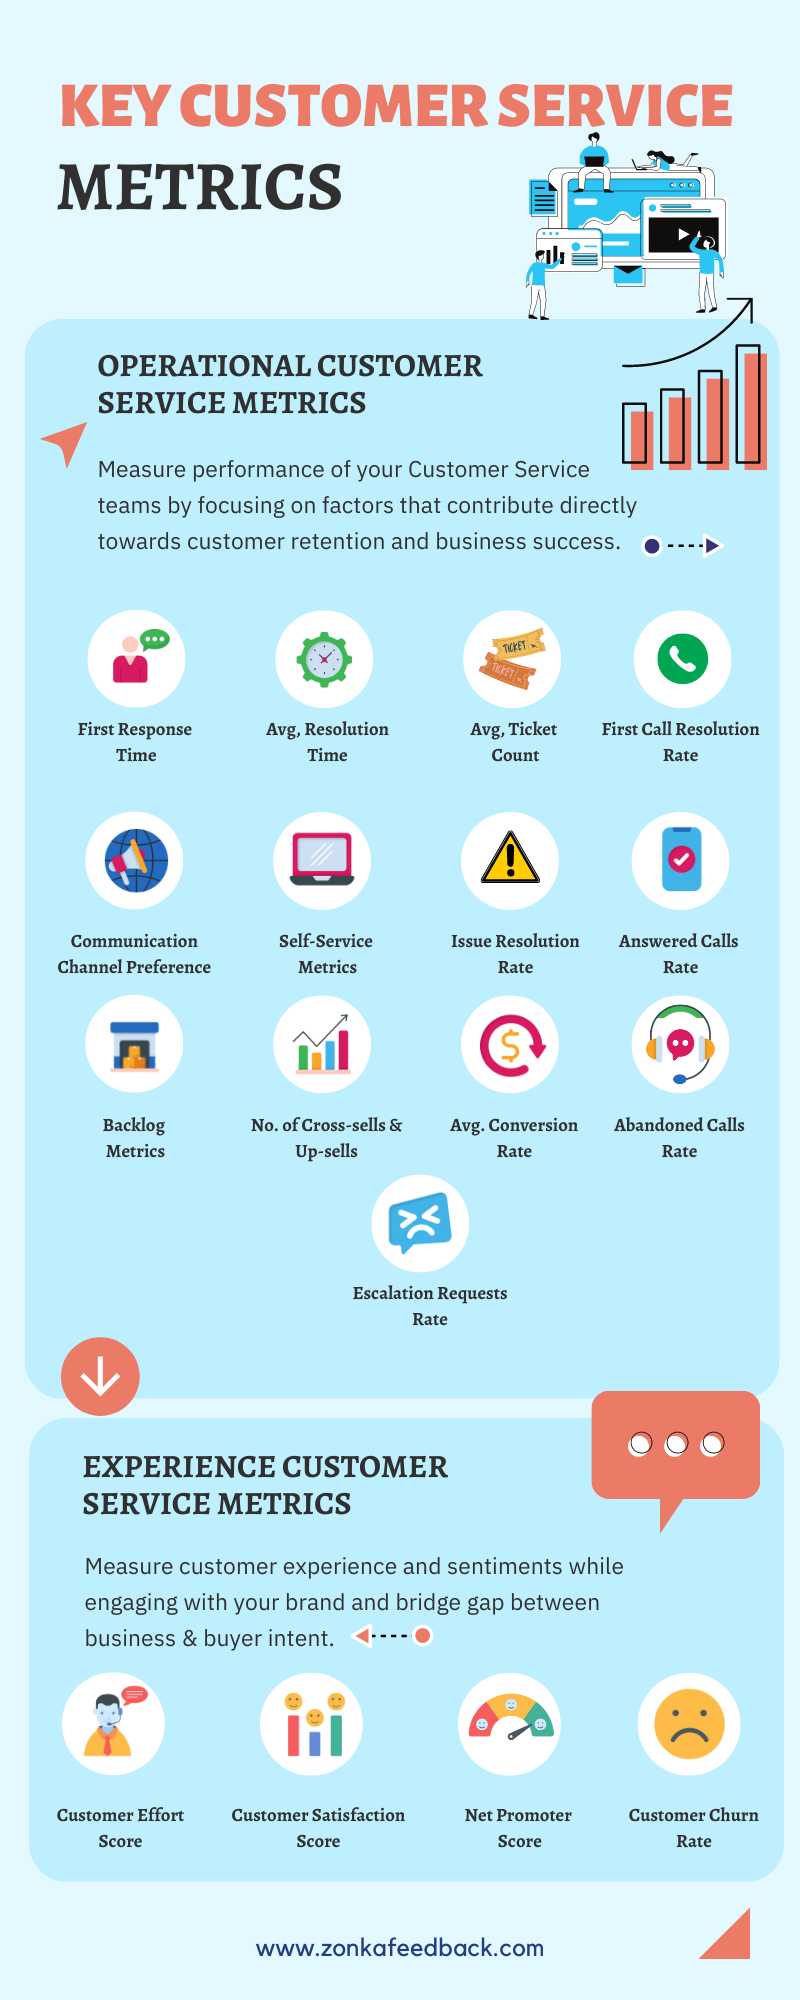
1. Operational Customer Service Metrics
Operational Customer Service Metrics give you data on the performance of your Customer Service teams by focusing on operational factors like response rate, a number of tickets/emails, resolution time, etc, that contribute directly towards customer retention and overall business success.
2. Customer Experience Metrics
Customer Experience Metrics, as the name suggests, talks more about the customer experience and their sentiments while engaging with your brand. These metrics help bridge the gap between business intent and buyer intent based on sentiment analysis. It not only talks about the Customer Service but the overall performance of your product/service, how customers feel while engaging with your brand, and how loyal they are. That way you can focus your efforts in the best way possible to maximize business growth.
Customer Service Metrics Overview for 2026
| Metric Category | Metric Name | What is Measures | Why it Matters |
| Operational Customer Service Metrics | First Response Time (FRT) | Time taken to send the first response to a customer | Sets customer expectations and first impression |
| Average Resolution Time | Time taken to fully resolve a customer issue | Reflects efficiency of support processes | |
| Average Ticket or Issue Count | Number of support requests received | Helps identify demand trends and recurring problems | |
| First Call Resolution Rate | Issues resolved in the first interaction | Reduces repeat contacts and customer effort | |
| Communication Channel Preference | Channels customers prefer for support | Helps allocate resources effectively | |
| Self-Service Metrics | Usage of FAQs, chatbots, and help centers | Reduces support load and speeds up resolutions | |
| Issue Resolution Rate | Percentage of issues successfully resolved | Indicates overall support effectiveness | |
| Answered Calls Rate | Calls answered by support agents | Prevents missed queries and customer frustration | |
| Backlog Metrics | Number of unresolved or delayed tickets | Highlights capacity and process gaps | |
| Cross-sells and Upsells | Revenue generated during support interactions | Shows support impact on business growth | |
| Average Conversion Rate | Conversions influenced by customer support | Connects service quality with sales outcomes | |
| Abandoned Calls Rate | Calls dropped before reaching an agent | Signals long wait times or staffing issues | |
| Escalation Requests Rate | Issues escalated beyond first-level support | Identifies training or complexity challenges | |
| Customer Experience Metrics | Customer Effort Score (CES) | Ease of resolving issues or completing tasks | Lower effort improves retention |
| Customer Satisfaction Score (CSAT) | Satisfaction after an interaction | Measures short-term service quality | |
| Net Promoter Score (NPS) | Likelihood of recommending the brand | Indicates loyalty and advocacy | |
| Customer Churn | Rate at which customers leave | Highlights retention and experience risks |
A Complete List of Important Customer Service Metrics in 2026
Below are the most important customer service metrics to track in 2026, divided into Operational Customer Service Metrics and Customer Experience Metrics, to help you measure both support efficiency and customer satisfaction effectively.
What are Operational Customer Service Metrics?
Operational Customer Service Metrics focus on how efficiently your customer service team handles support requests on a day-to-day basis. These metrics measure factors like response time, resolution speed, ticket volume, call handling, backlog, and channel performance. Together, they help businesses understand how well their support operations are running, how productive agents are, and where processes need improvement to deliver faster and more reliable customer support.
Let’s take a closer look at the key Operational Customer Service Metrics you should track.
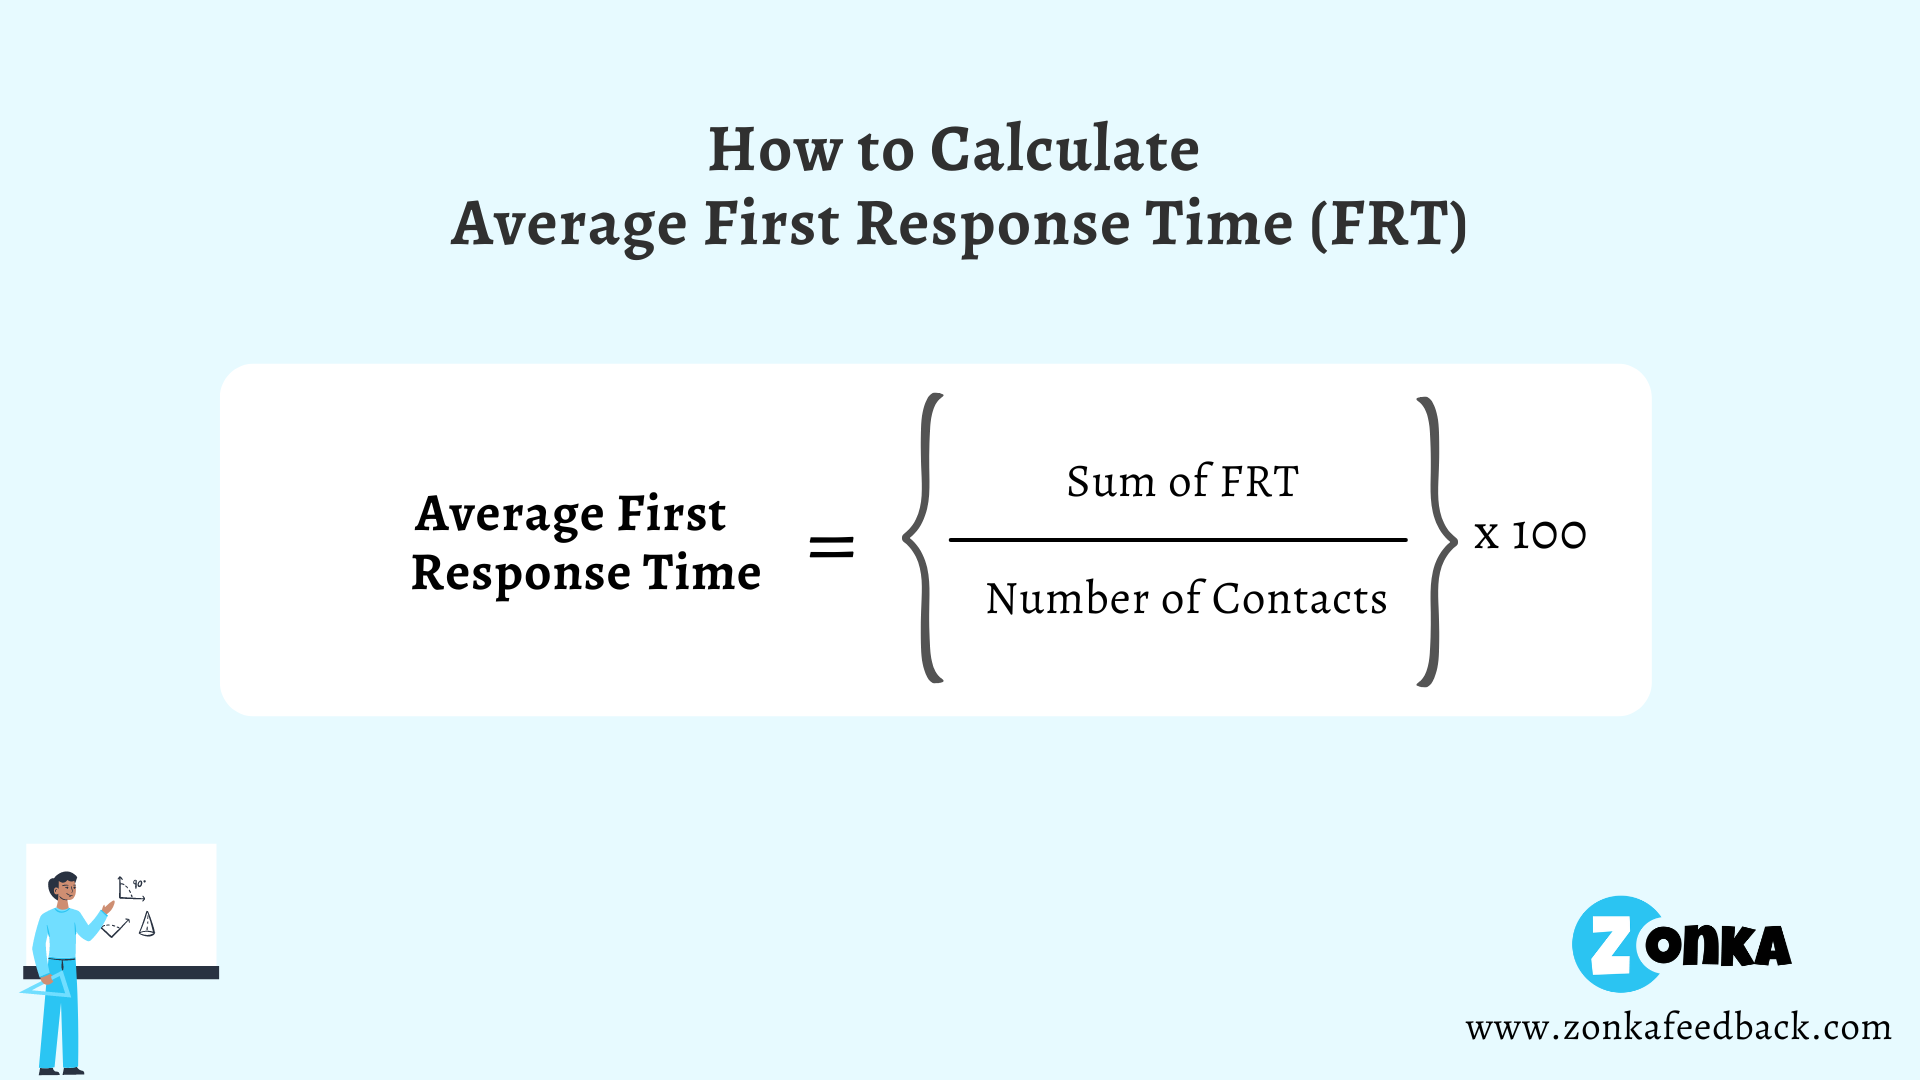
1. First Response Time (FRT)
First Response Time indicates the time taken by an agent to respond to a support ticket or request in the initial stage. Customers expect a fast response when they face an issue and raise concerns. Although it makes sense to send an instant automated message that says something like “our support team will be in touch soon,” it doesn’t really matter to the customer until they personally get in touch with a living breathing human being.
This doesn’t mean raising an alarm in your Customer Service department as soon as a ticket is raised but setting up processes is somewhere a business can start. For example, if the query is generated via email or online form, keep the response time to 24 hours or less; If the query is generated via social media, respond try responding within 60 minutes; for live chats, set up instant response processes, and so on.
How to Use First Response Time?
Setting up the First Response Time requires you to start with setting the right expectations and mentioning the specific period of response time in your automated message to the customer. If your Customer Service team is not being able to respond to tickets on time, find out why it’s happening and work towards fixing the loopholes.
Calculating the response time is very simple. All you need to do is subtract the time of customer request from the time of the first response. It will give you the First Response Rate.
Best for: Measuring how quickly your customer service team acknowledges customer issues and sets the first impression of your support experience.
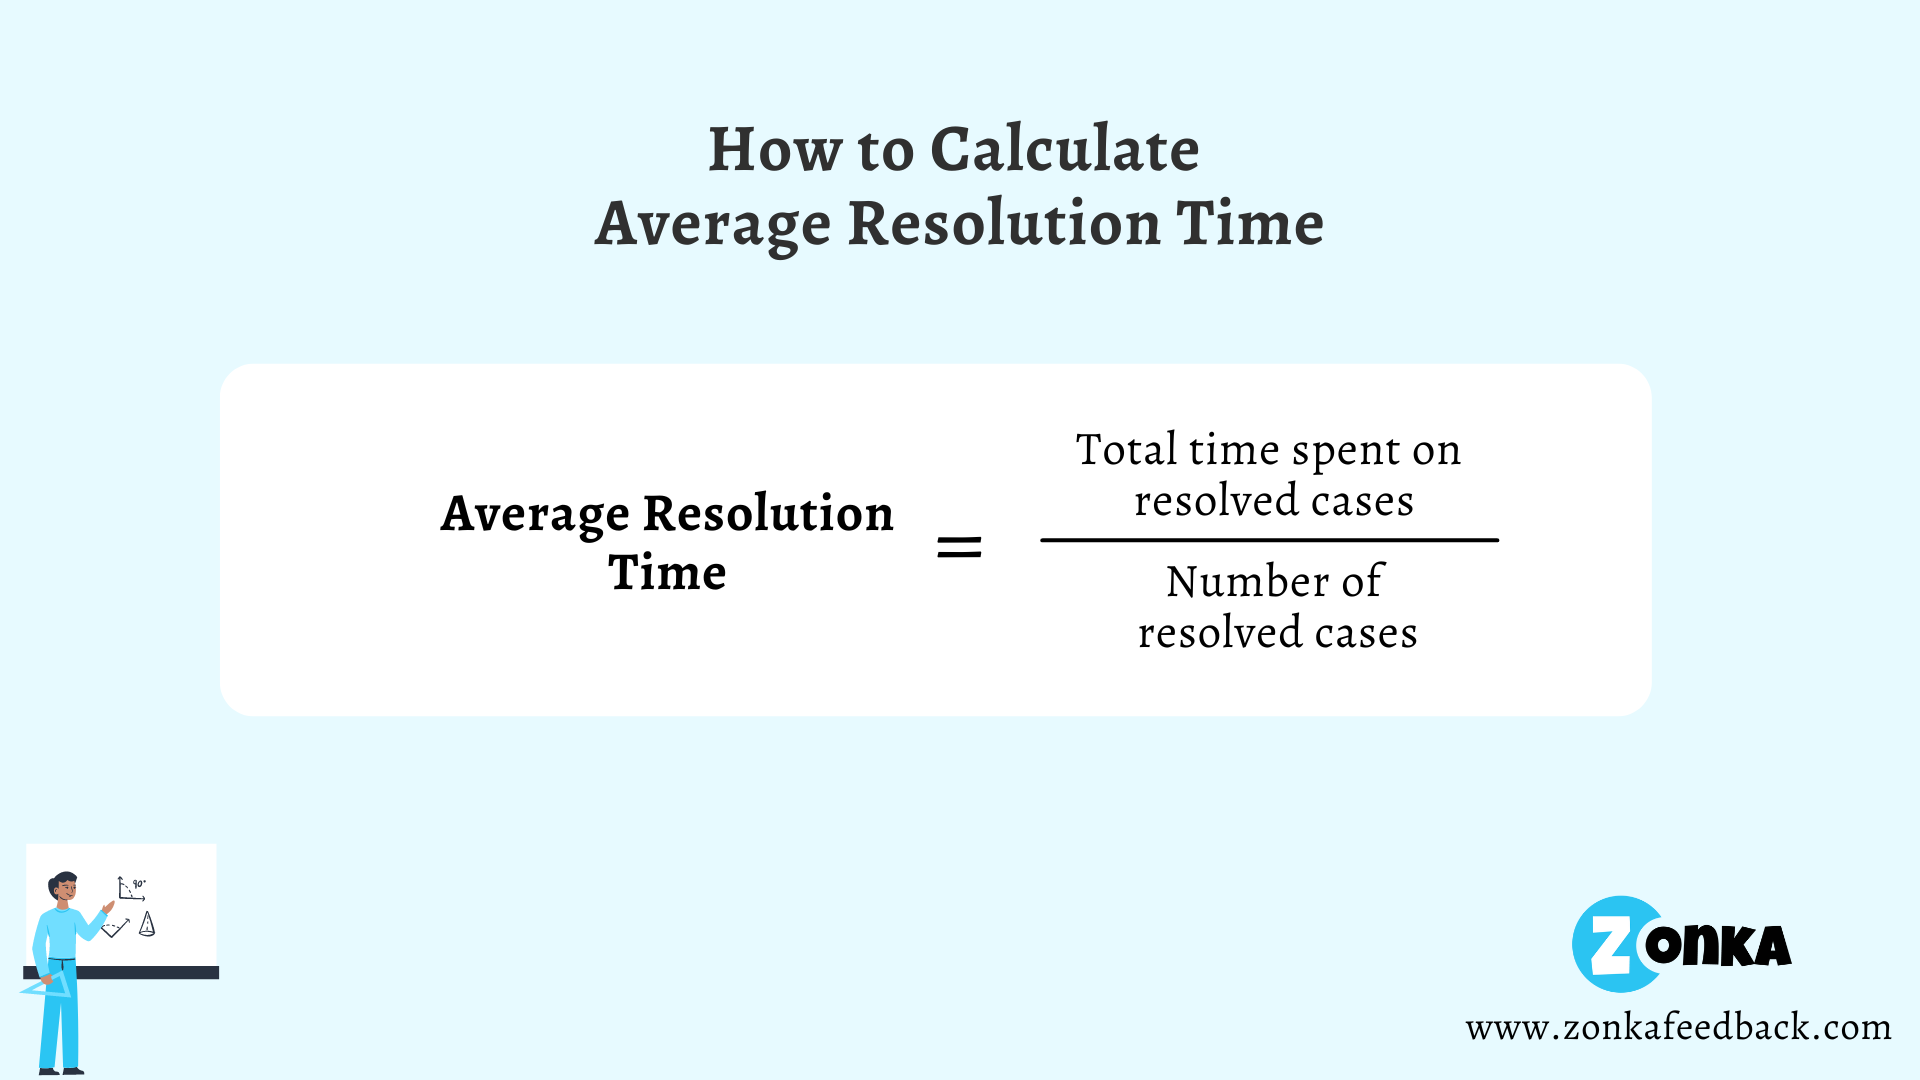
2. Average Resolution Time
As the name suggests, Average Resolution Time denotes the amount of time it takes for the support agent to resolve the customer’s issue. It is among the important Customer Service Metrics that a business needs to measure to improve its overall customer satisfaction. In fact, for over 73% of customers, fast query resolution is an indicator of a good Customer Service experience.
Monitoring the resolution time will give you crucial insights into the trends across different types of customer issues and the efficiency of individual Customer Service agents. Of course, not all issues as the same. Some can be resolved instantly while some might take a little bit more time.
How to Use Average Resolution Time?
Measuring the resolution time uncovers any underlying problems in case the average runs high. From poor coordination among teams to a lack of training to resolve complex issues; there are multiple factors that may affect the outcomes of this metric. The goal here is to close the feedback loop fast which can give boost your customer satisfaction.
In order to calculate the average resolution time, all you need to do is divide the total number of tickets by the number of tickets resolved to give you the overall resolution rate.
Best for: Understanding how efficiently customer issues are resolved and identifying delays in support workflows or agent performance.
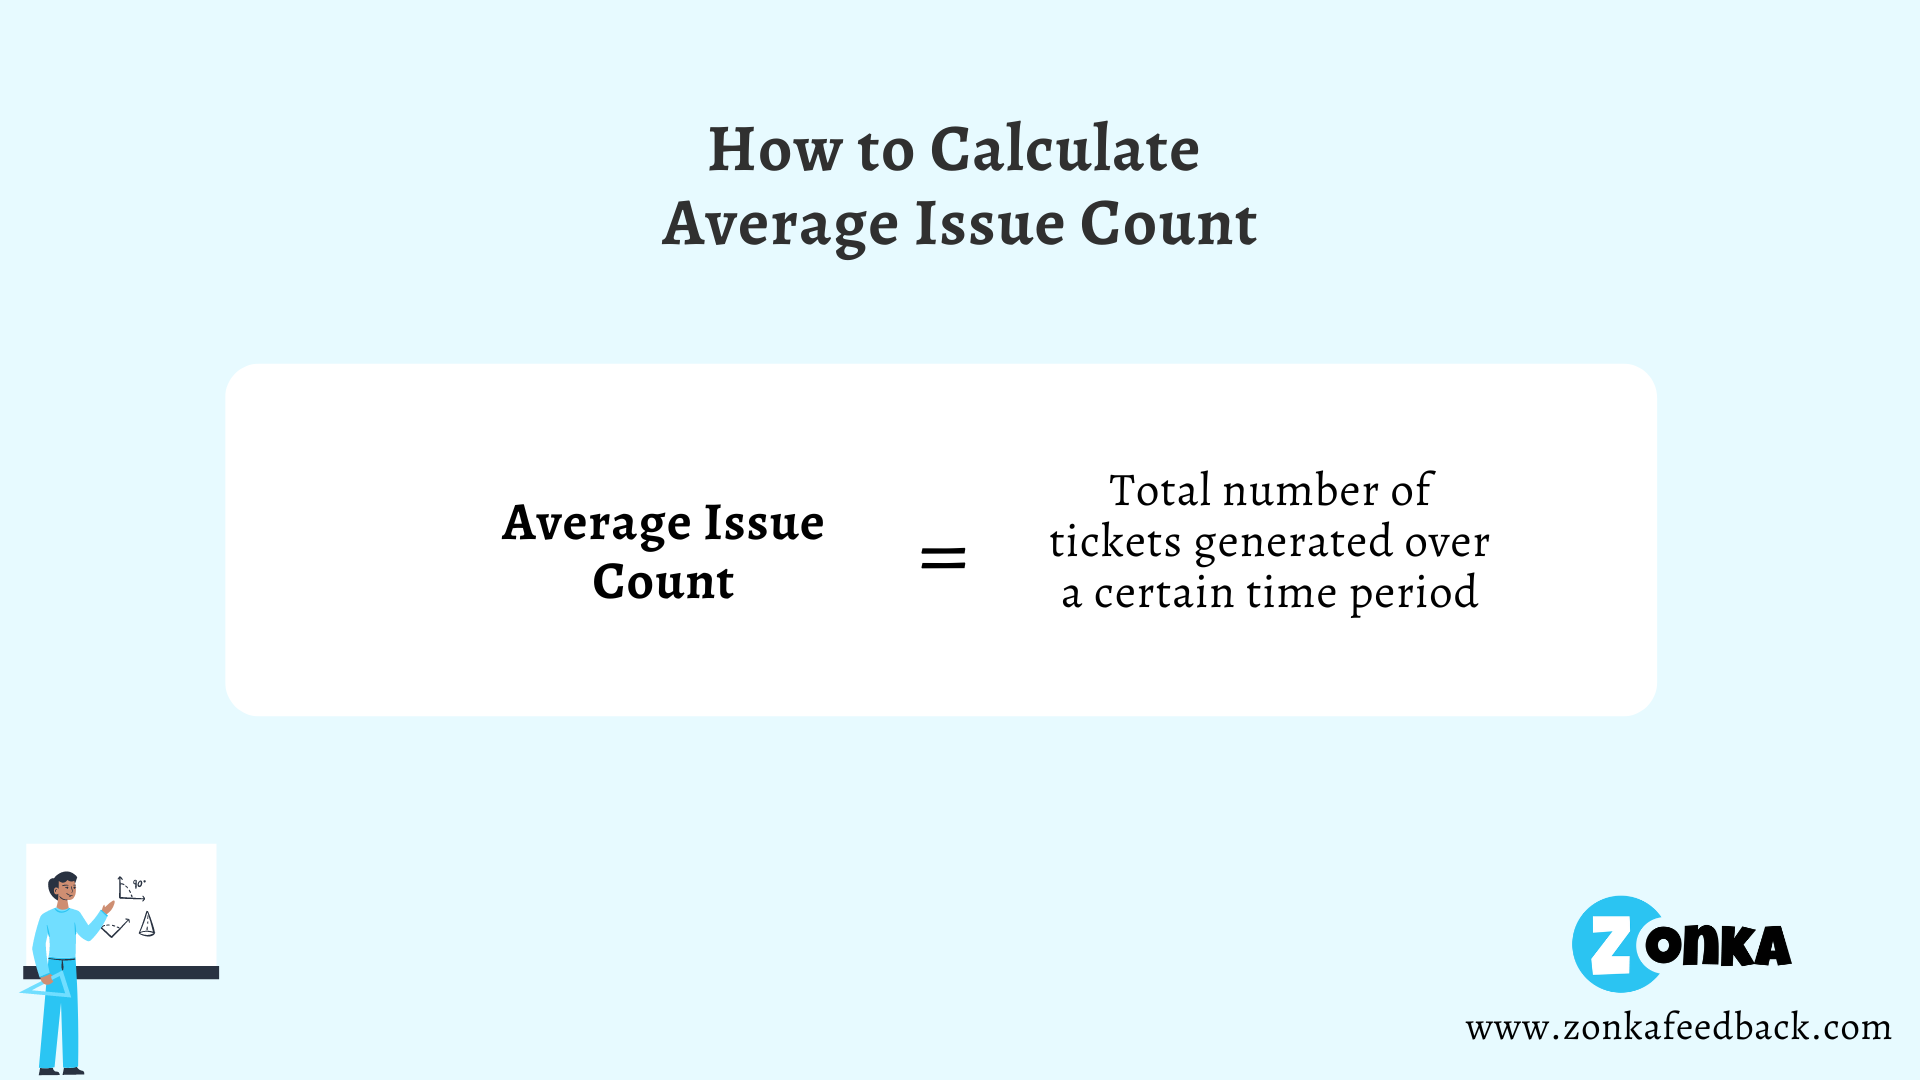
3. Average Ticket/Issue Count
For many businesses, a high daily ticket count may come across as an indicator of the high level of customer engagement with the brand but it might also point toward possible underlying issues with the product or a lack of Customer Service agents in the team to address customer complaints. Calculating the average daily/weekly/monthly count may help businesses uncover such issues and make the required changes the improve Customer Service experience.
How to Use Average Ticket/Issue Count?
It goes without saying that a proactive approach toward customer support and product iteration can possibly decrease the ticket count. You may also need to ensure that your team is prepared for instances that may cause high ticket rate example introduction of a new feature, during a discount/offer phase, or while offering free trials.
To calculate these Customer Service Metrics, simply compare the support tickets over a specific period of time. Also, track which events are causing a spike in those numbers so that you can get a better idea about which segment requires changes or improvements.
Best for: Tracking overall support demand and identifying spikes caused by product issues, feature changes, or seasonal trends.
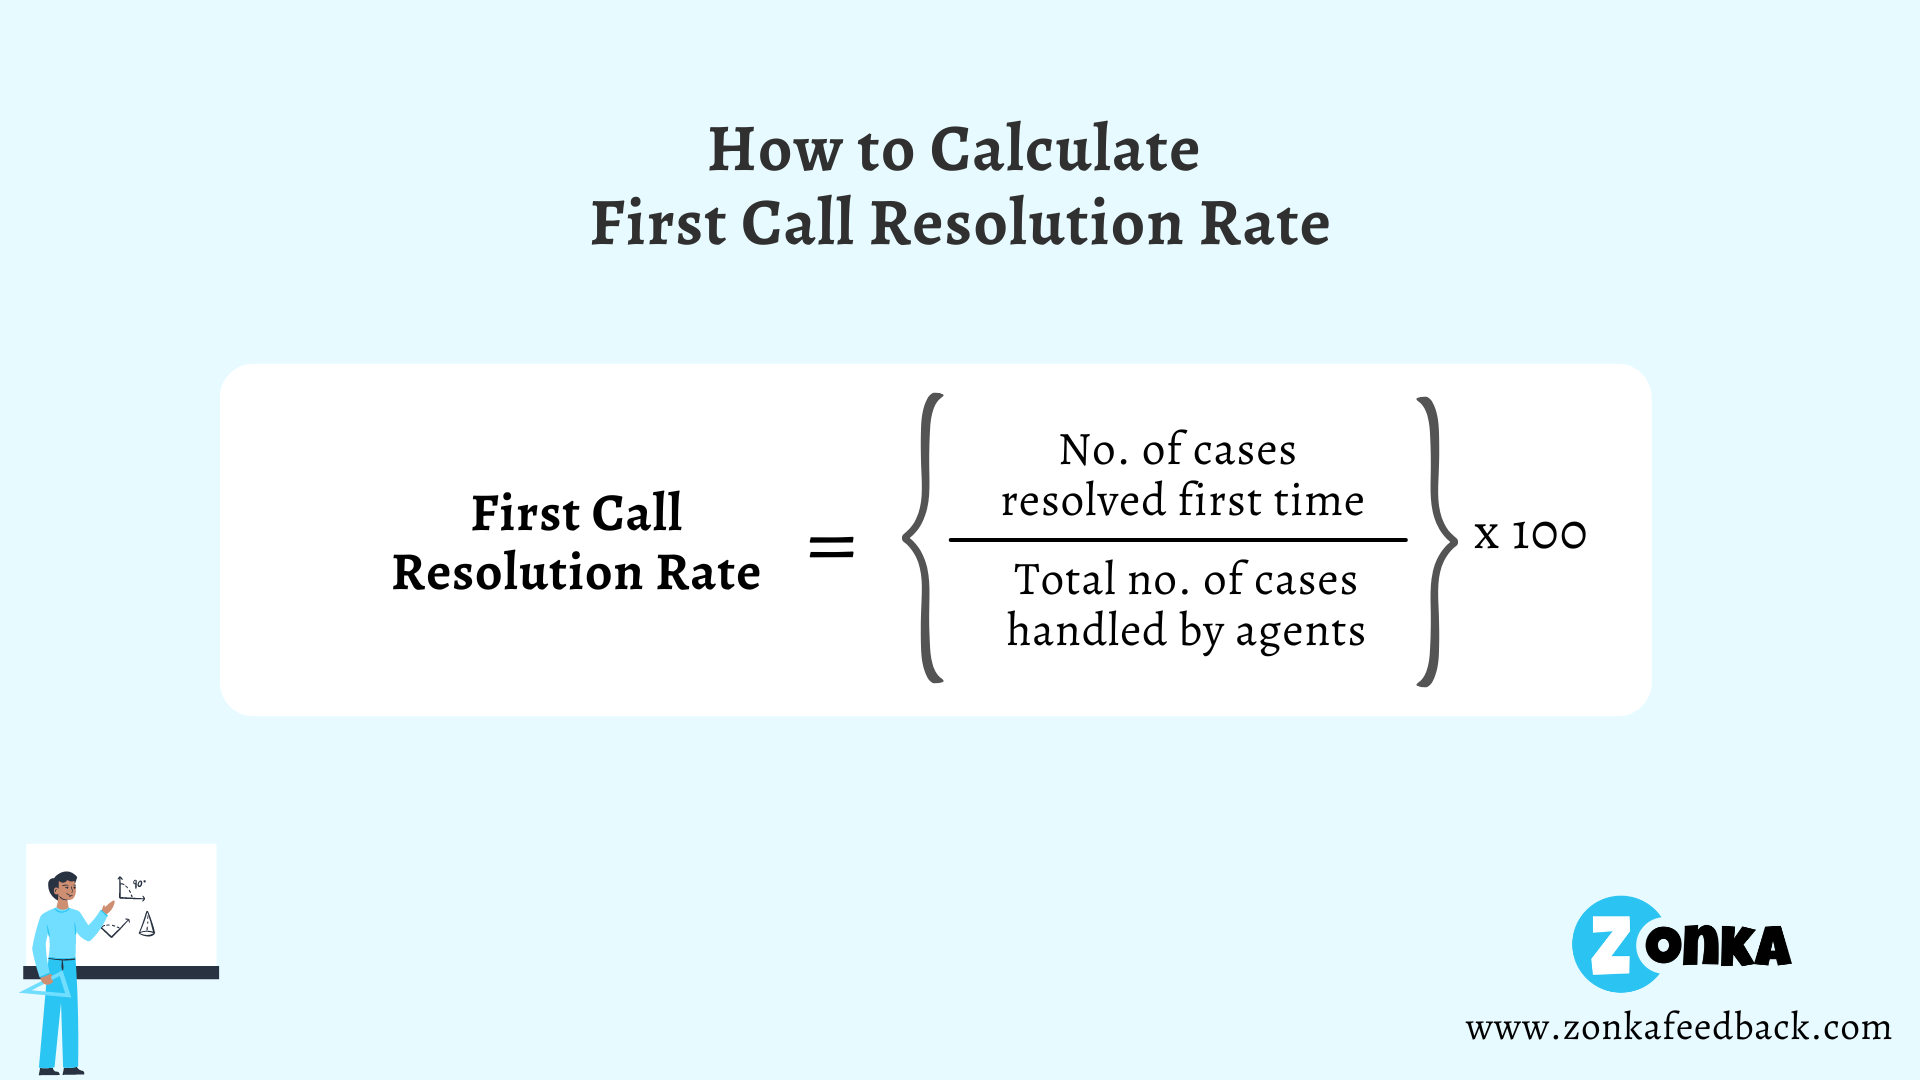
4. First Call Resolution Rate
The First Call Resolution rate gives you the data on how successfully the Customer Service agents are being able to resolve customers' issues after the first contact/call. This is another Customer Service Metric that tells you how efficient your team is as well as how happy/satisfied your customers are.
A study revealed that 60% of companies that tracked their First Call Resolution rate over a year reported a 30% improvement in performance. A high first-call resolution rate will most likely give you the CES score. The lesser the effort customer puts in, the higher will be the CES score.
How to Use First Call Resolution Rate?
Calculating the first call resolution rate where the customer issue is resolved without the need for follow-up calls can highly improve the number of satisfied customers. It’s a valuable skill for a Customer Service agent to be able to resolve customers’ issues in a single interaction.
To calculate the first call resolution rate, just divide the number of issues resolved on the first contact by the total number of issues.
Best for: Evaluating how effectively agents resolve customer issues during the first interaction without the need for follow-ups.
5. Communication Channel Preference
Although recently added, measuring these Customer Service Metrics is important for businesses that want to keep up with their customers’ preferences. Of course, the communication channel depends highly upon the type of business you are running. Small and medium businesses can use a client portal to manage all customer communication, whereas large businesses can use several communication channels. Additionally, businesses can create an app with an app maker for more effective and instant communication, But you can always keep an eye on your customers’ preferred channels and try to optimize those channels for a better Customer Service experience.
For instance, offering a range of options for communications and giving the baton to customers’ hands, and letting them choose their preferred one can make a big difference in the way customers look at your business. You can also figure out which channels are most preferred and receive the most amount of engagement so that you can put more manpower there.
How to Use Customer Communication Channels?
The best way to utilize customers’ preferred communication channels is by assigning the right amount of team members per channel to get the most out of them. This way you can ensure that no customer complaints go unanswered. Also, setting up notifications on those channels can help you in keeping informed about new customer queries.
Best for: Understanding which support channels customers prefer and allocating resources to the most used and effective communication channels.
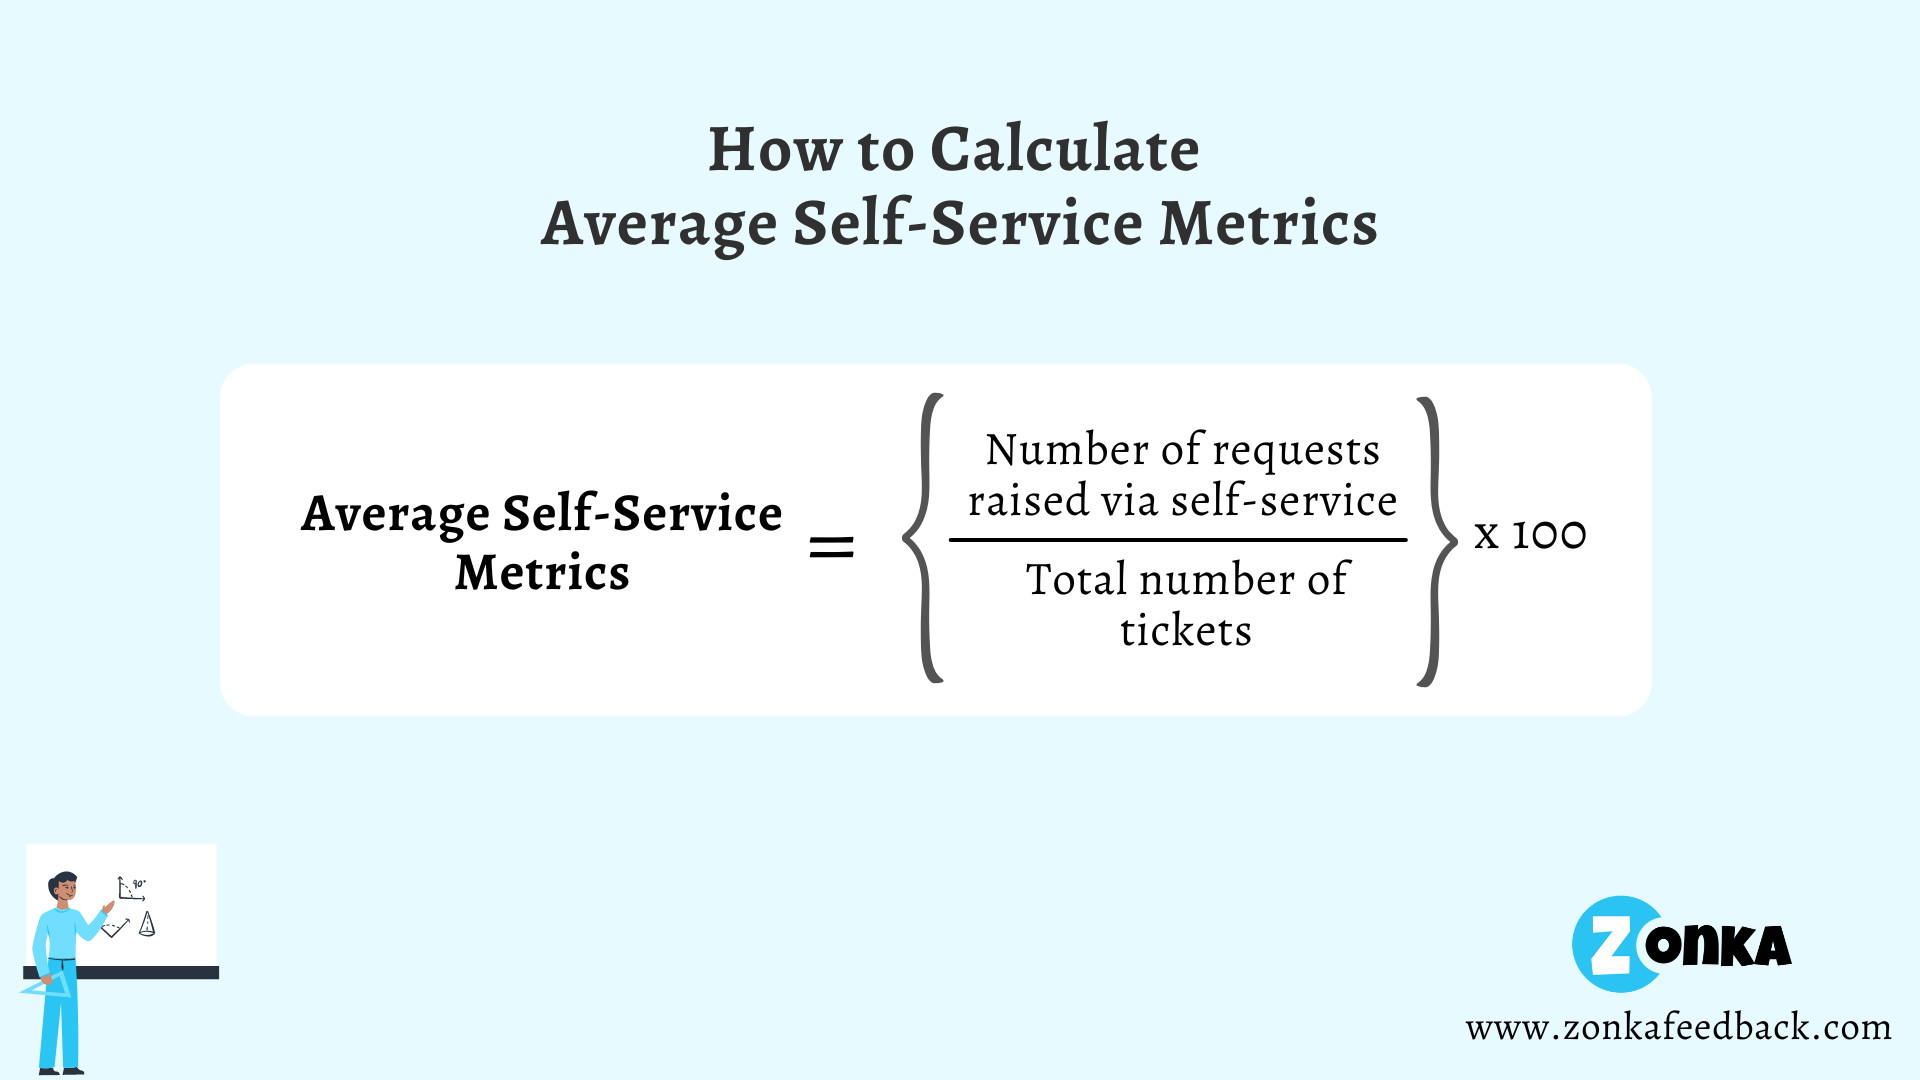
6. Self-Service Metrics
Always assume that customers are smart because eventually they will be using your product and will know what’s right or wrong with it. So, adding a self-service option can actually make things easy for you in the long run. A Freshworks study showed that over 39% of customers say that they prefer self-service options over other Customer Service channels because for them, it’s a faster way to solve their problems.
When you offer a self-service option to the customers, your Customer Service team can focus on solving more complex problems rather than going over the same questions again and again. On top of that, self-service tools are easy to track and can give you reliable data devoid of human errors.
How to Use Self-Service Metrics?
Start with optimizing your self-service tools to accommodate customer complaints on your website, social media, and other communication channels. Increasing accessibility to your ‘Help’ pages not only improves customer satisfaction but also supports efforts to grow your social media business by fostering better engagement and trust.
There are plenty of tools available to enable self-service, the most common being the Chatbots. Interactive chatbots equipped with AI can help customers solve their queries without interaction with a Customer Service agent. An increase in the usage of self-service options can indicate possible success.
Best for: Measuring the effectiveness of self-service options like FAQs, help centers, and chatbots in resolving customer issues independently.
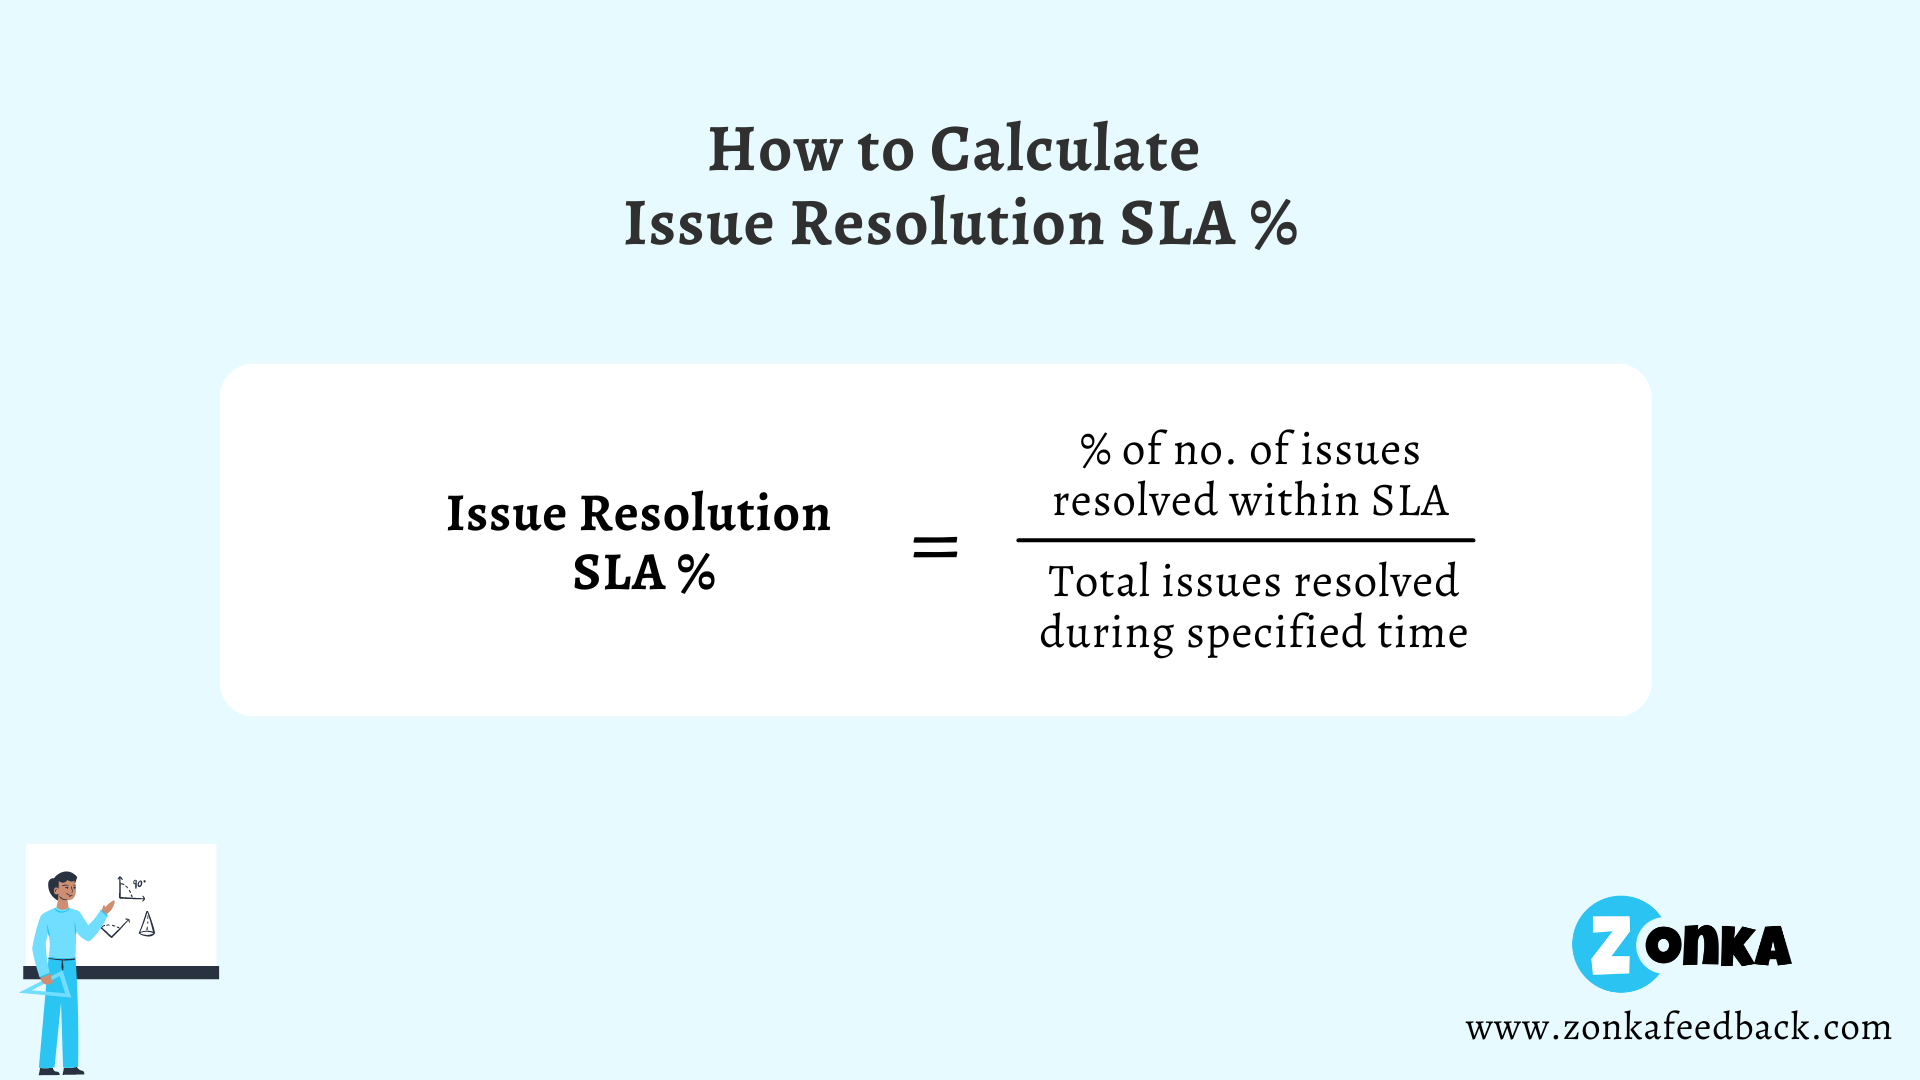
7. Issue Resolution Rate
This goes without saying, the issue resolution rate is among the top Customer Service Metrics you should be measuring. It gives you the percentage of issues getting solved by your Customer Support Agents out of the total number of queries. To improve the resolution rate, a company requires much better back-end support that can resolve the issues quickly and efficiently.
How to Use Issue Resolution Rate?
The issue resolution rate again indicates the efficiency of the team. Although one might want to resolve all the issues, it can become impossible in some cases. That’s when you need to dig deep and look closely to identify the reasons for it.
The best way to handle this is to provide some or other solution to the customer and not end the call without giving them something. The best practice is to let the customers know about the duration they have to wait to get the issue resolved. You can easily set this up by establishing a Service Level Agreement policy for the CS team.
Best for: Assessing the overall success rate of your support team in resolving customer issues within defined service standards.
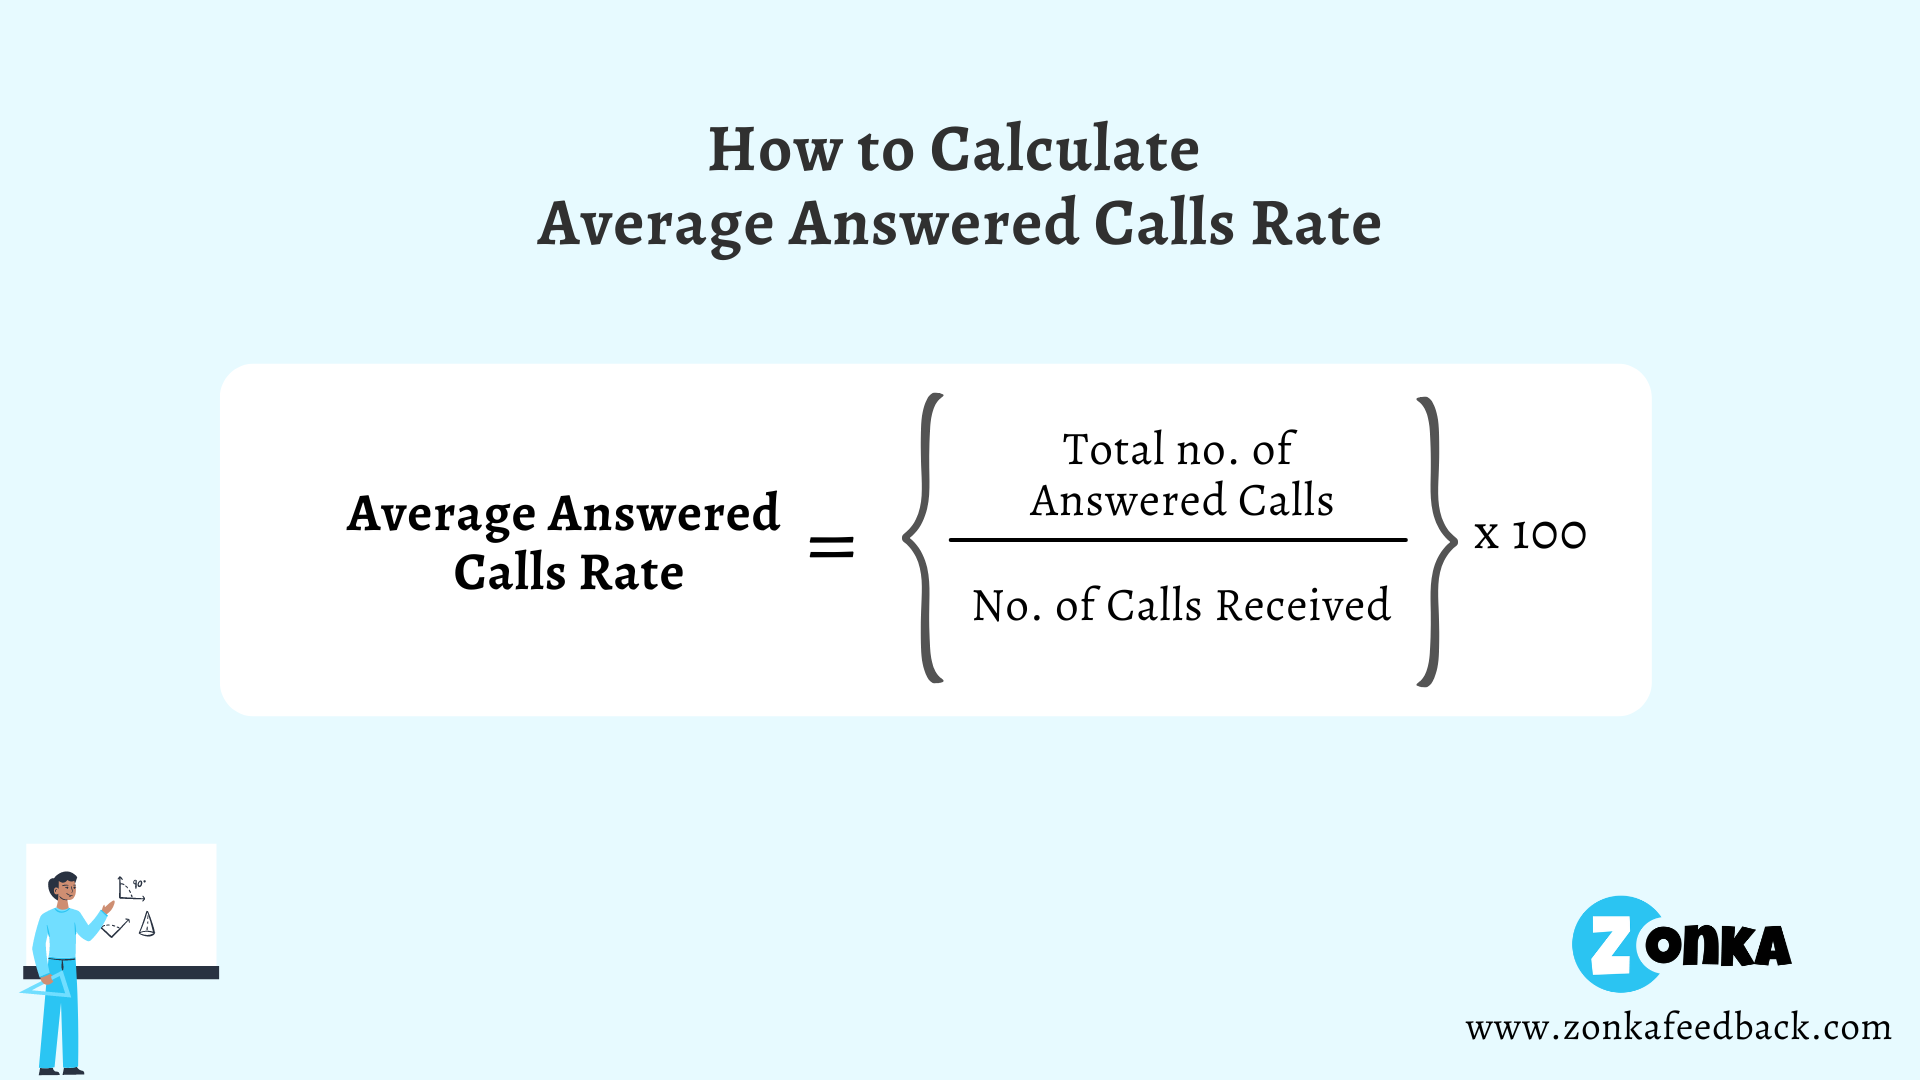
8. Answered Calls Rate
This is another important Customer Service Metric that can give you data on the efficiency of the team. It’s easy to calculate this metric by comparing the number of answered calls with the total calls received at the Customer Service/Support Centre.
It’s essential for companies to have a higher answered call rate to improve customer experience. The more calls a company misses, the higher the chances of customers having a negative experience. This may lead to frustration and a higher churn rate.
How to Use Answered Calls Rate?
The average answered calls rate can tell you how effectively the Customer Service Agents are working on resolving the issues and tending to the customer complaints. To calculate these metrics, just divide the number of answered calls by the number of calls received. It will give you the Answered Calls Rate.
Best for: Monitoring call handling efficiency and ensuring customer calls are answered promptly without excessive wait times.
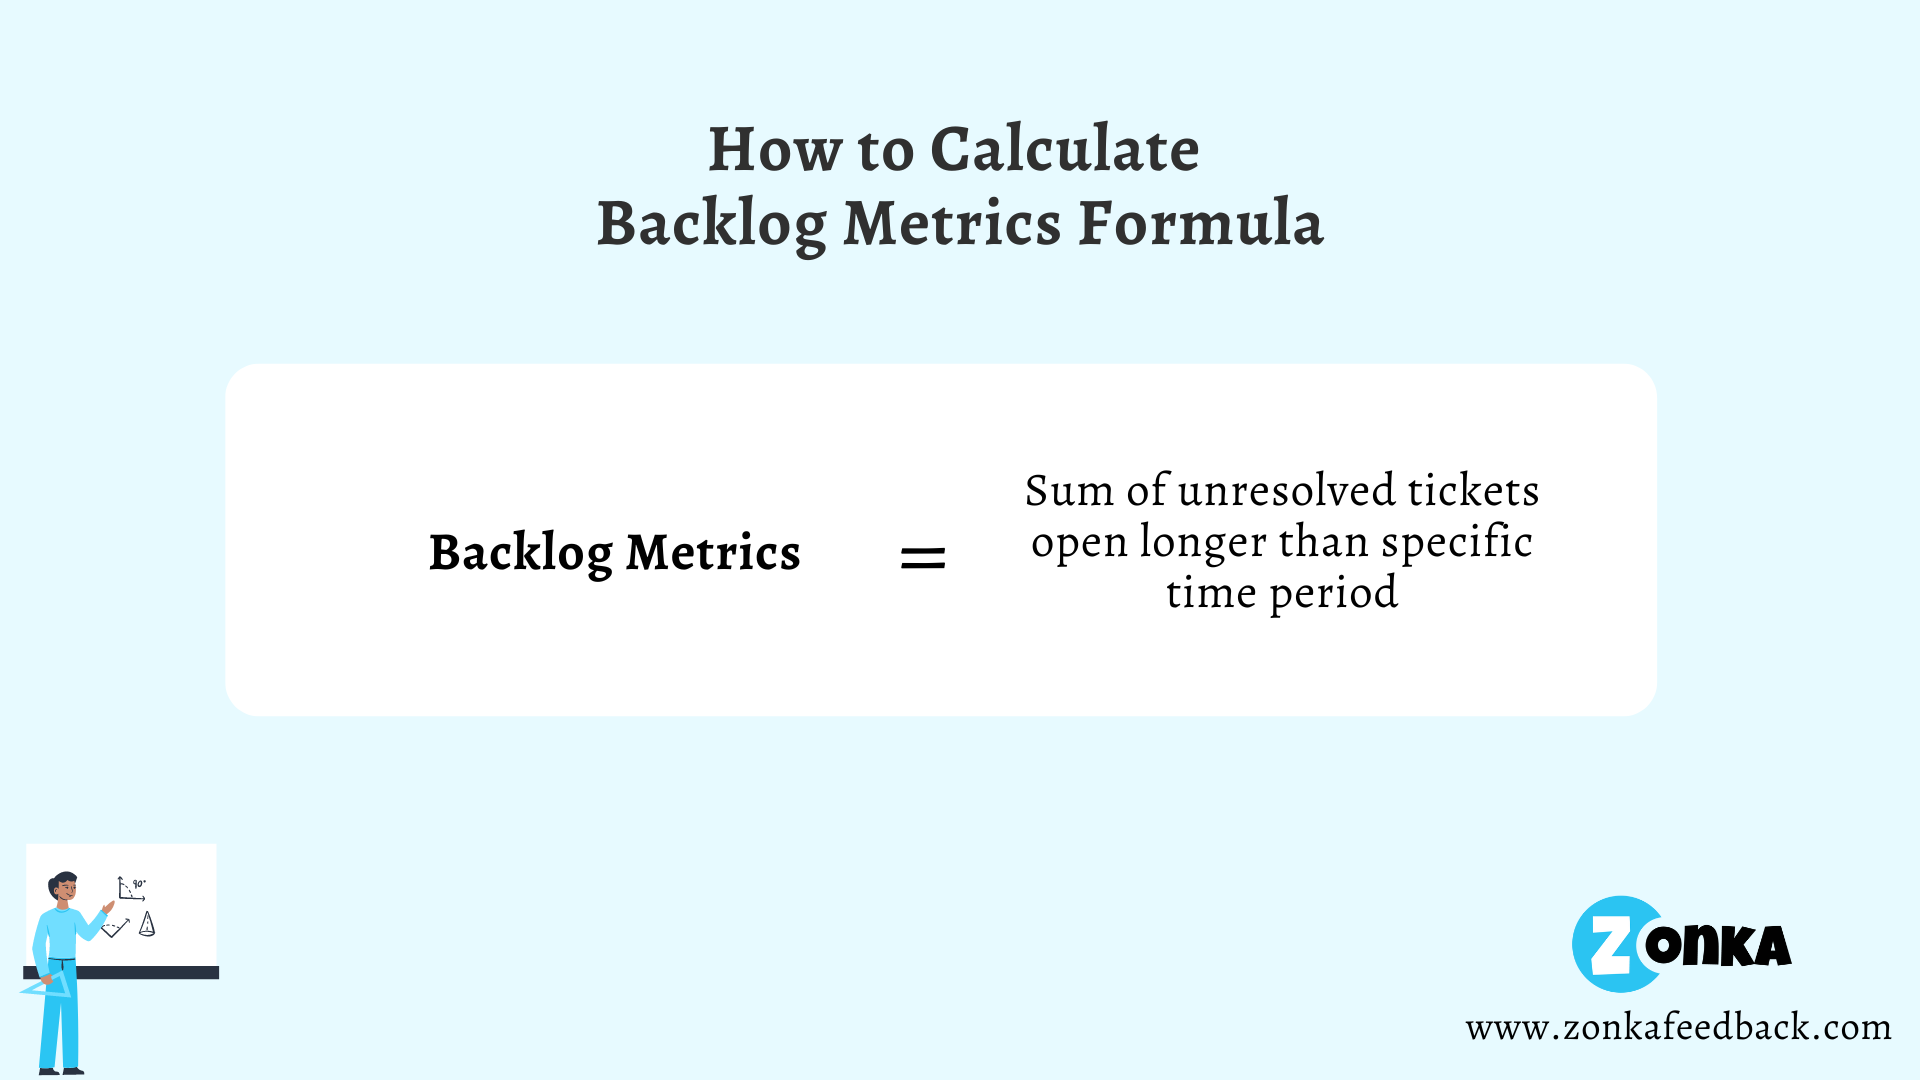
9. Backlog Metrics
While tending to the customer requests, it so can happen that some requests get accumulated over a period of time. While many companies try to cut down on this number, but sometimes it becomes inevitable when you don’t have proper resources to back your Customer Service efforts.
The higher the backlog gets, the more customers one has to deal with. These customers literally hang by thread and can switch any time if their issues don’t get resolved on time. There are a bunch of reasons why this could happen. For starters, it could be due to fewer agents and a high volume of calls or inefficient team members, or complicated product issues.
How to Use Backlog Metrics?
In case you see an inclination in the backlog but the number of tickets coming in and getting resolved remains the same, it might be time to hire new Customer Service agents. In case the agents are taking more time to resolve the issues, it might be a defect in the processes to handle requests that might need the change.
The best way to start is by calculating the Backlog metrics and to do that, first establish a time frame for resolving those issues. Once established, take note of the tickets that take more than that time to resolve the tickets. That will give you the backlog numbers.
Best for: Identifying unresolved or delayed tickets and understanding whether your team has enough resources to handle incoming requests.
10. Number of Cross-sells and Upsells
The doings of Customer Service Teams can directly affect the “doings” of Sales Teams. While dealing with customers’ problems, businesses need to put more efforts and resources into their Customer Service Teams so that they can upsell and cross-sell to the customers.
Upselling can happen when you convince the customers into buying another version of the product which might be a little more expensive. Cross-selling n the other hand is when you can sell additional products with the existing ones. Tracking the number of upsells and cross-sells can come down to the efficiency of the Customer Service Agents and how good they are at convincing the customers.
Best for: Measuring how customer service interactions contribute to additional revenue through relevant upsell and cross-sell opportunities.
11. Average Conversion Rate
The chances of conversions increase when a customer support agent successfully answers/resolves a customer’s issue during buying journey. It’s based on the stats presented by Forrester.
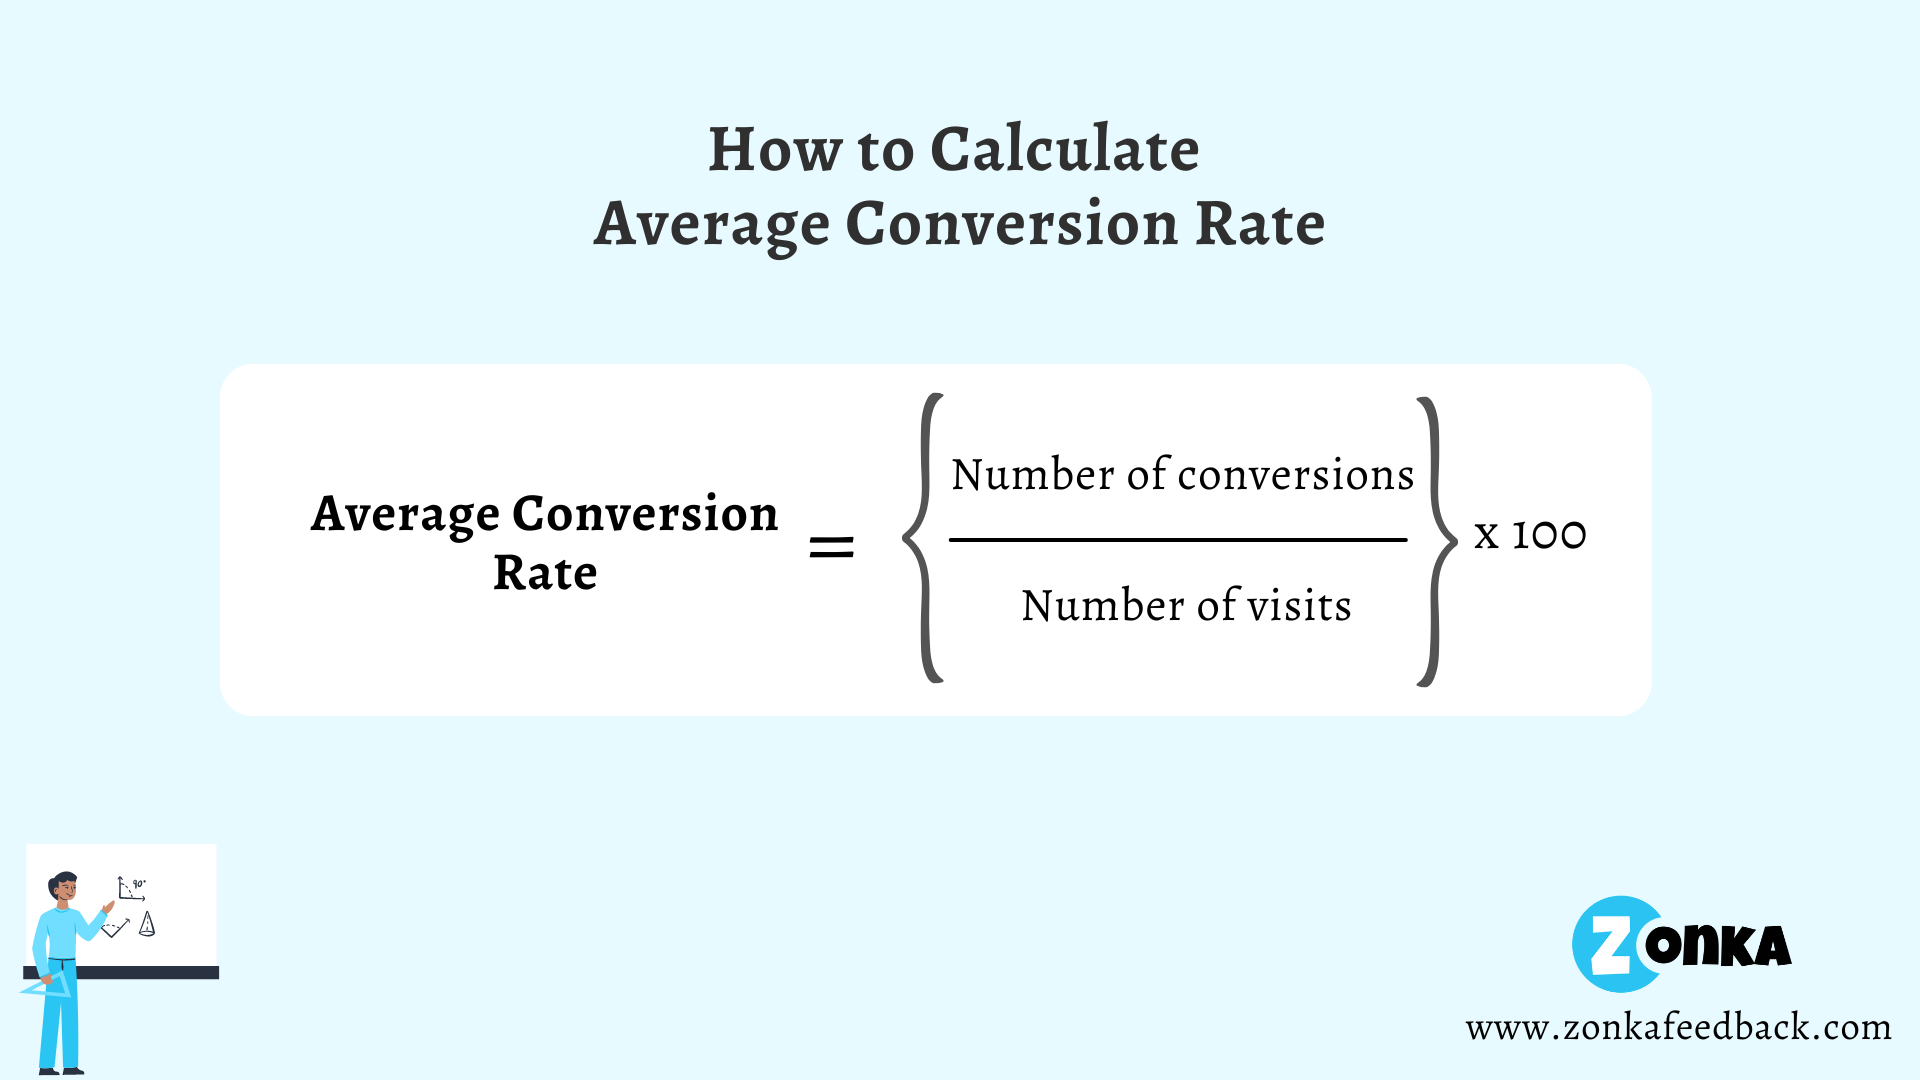
The average conversion rate metrics indicate the number of visitors who have successfully completed their action on your site. Of course, the higher the conversions, the better. That means the right communication with the customer at the right time can make a big difference.
Measure Customer Service Performance
Improve your customer service and grow your business with real-time feedback
How to use Average Conversion Rate?
It is essential for a business to track its conversion rates. It offers crucial analytics and insights from the data that can be used to engage the customers the right way and enhance overall sales conversions.
To track the conversion rate, just divide the conversions by total number of visitors and multiply it by 100.
Best for: Understanding how customer support influences purchase decisions and conversions during the buying journey.
12. Abandoned Calls Rate
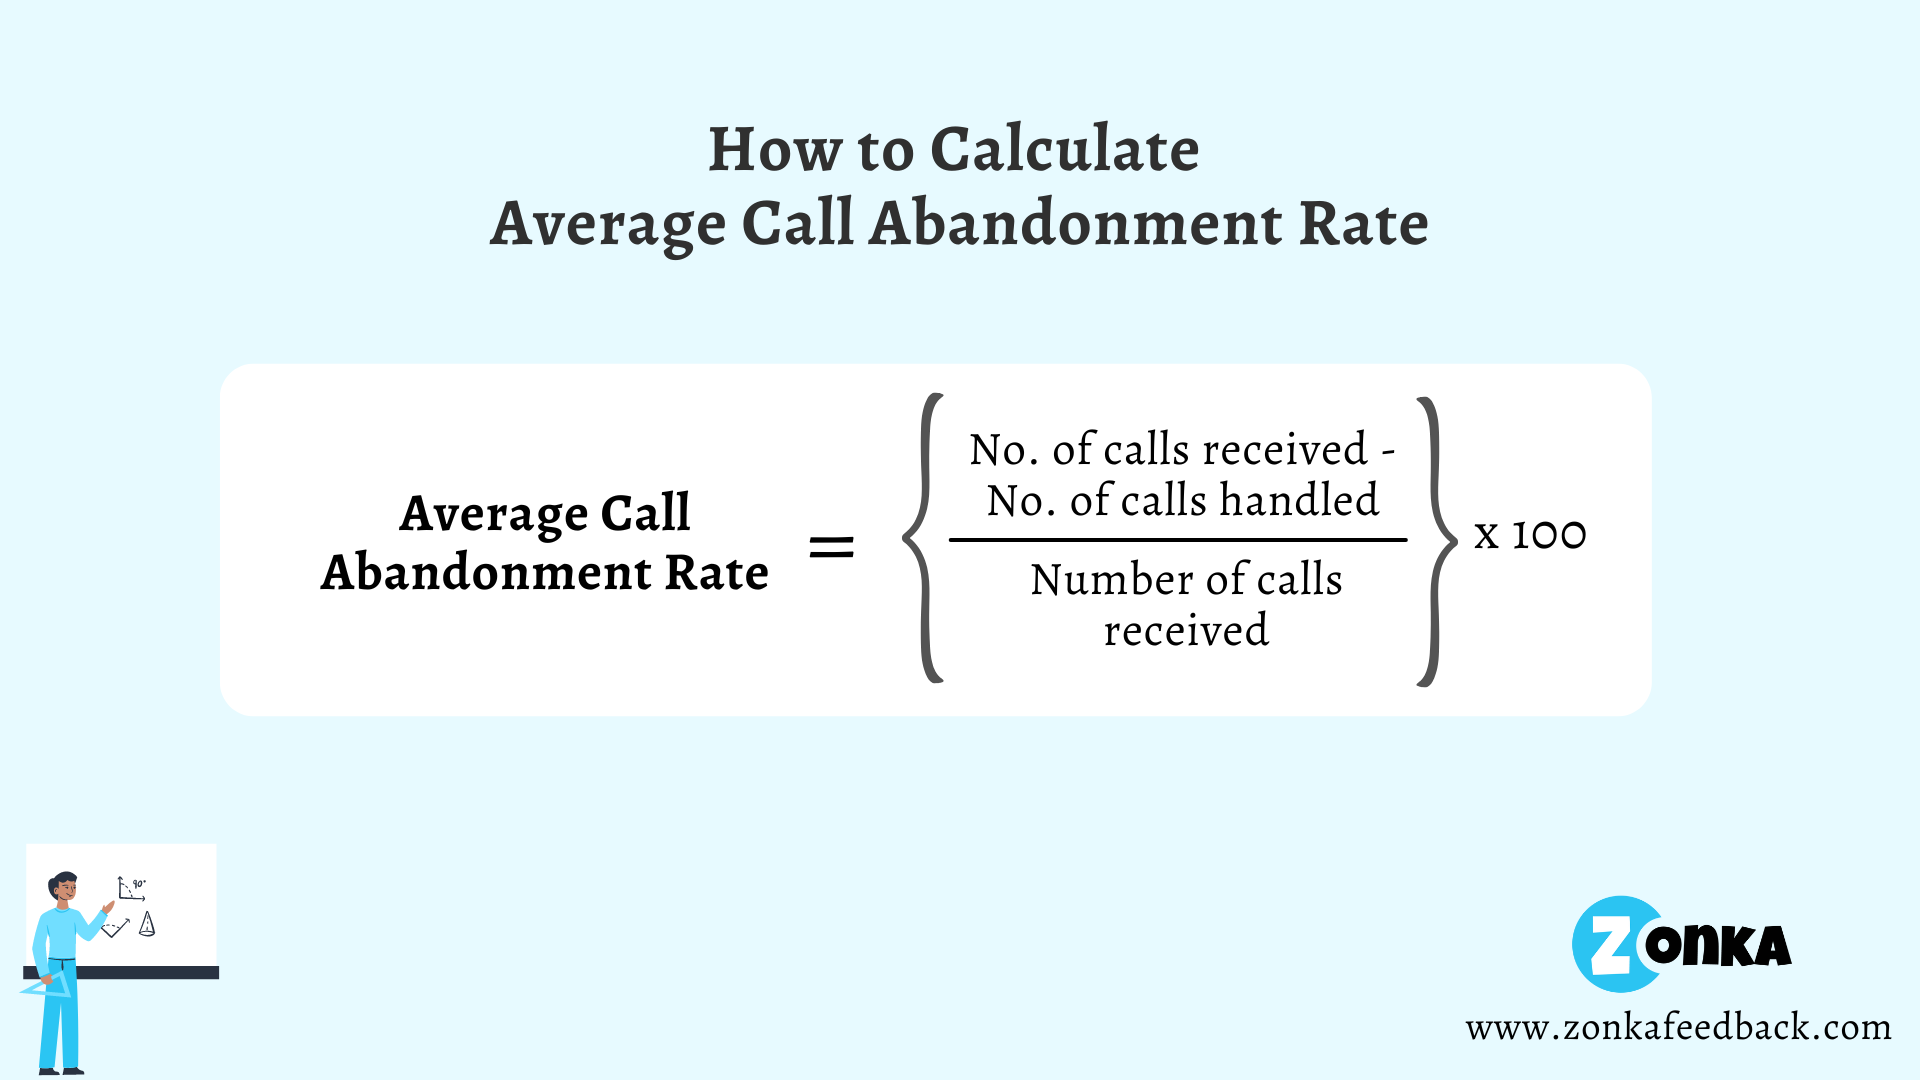
Another crucial Customer Service Metric is the abandoned call rates which are often overlooked but play a crucial role in measuring customer satisfaction. One of the primary reasons for it is the long wait time. Customers often get frustrated when they have to wait a long to get in touch with an agent.
Measuring this KPI can help businesses implement strategies that can deliver more proactive support to the clients and enhance their experience with Customer Service.
How to use Abandoned Calls Rate Metrics?
The best way to use these Customer Service Metrics is by understanding the expectations of the customers and providing them with the support that can lead to improved overall satisfaction thus reducing your call abandonment rate.
Best for: Identifying long wait times and capacity issues that cause customers to drop calls before reaching an agent.
13. Escalation Requests Rate
Escalation request rates offer a window to view the efficiency of Customer Support agents as well as the customer experience. These escalations might tell you that the agents need to do more to solve problems that might a bit complex and require higher product knowledge. Measuring escalation requests helps in identifying the areas of Customer Service that need improvement.
Best for: Detecting gaps in agent training or process complexity by tracking how often issues need to be escalated to higher support levels.
What are Customer Experience Metrics?
Customer Experience Metrics focus on how customers feel when they interact with your brand and customer service. These metrics measure satisfaction, effort, loyalty, and overall perception based on customer feedback and sentiment. They help businesses understand whether customers are happy, how easy it is for them to get help, and how likely they are to stay loyal or recommend the brand.
Below is a list of essential Customer Experience Metrics used to measure customer satisfaction and loyalty.
14. Customer Effort Score (CES)
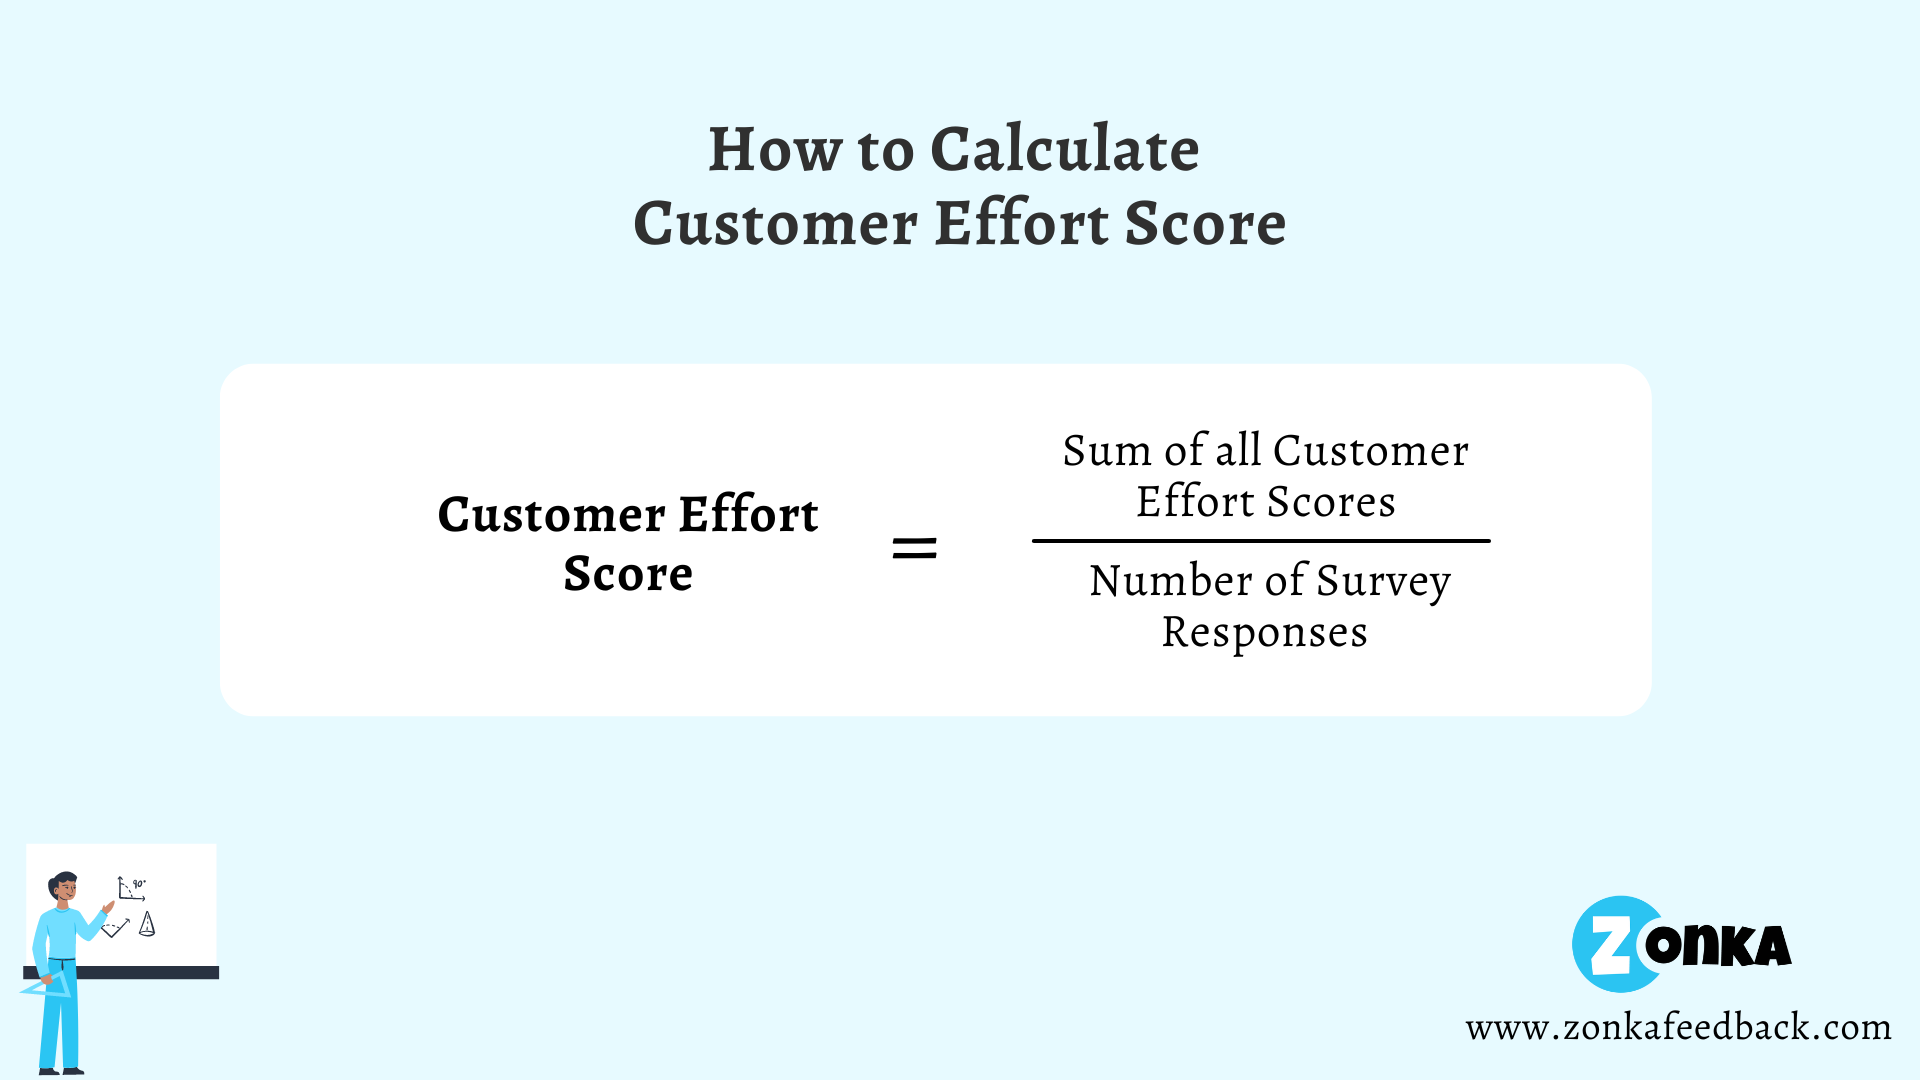
On top of the list of Customer Experience Metrics, measuring this Customer Service Metric is crucial for you to identify the amount of effort a customer has to put in to get their issues resolved, make a purchase, use your product, or speak to the Customer Service agent. The score can be easily collected using CES surveys that ask simple questions like -
- “To what extent do you agree or disagree that we made it easy for you to handle the issue?”
- “How prompt were we at addressing your concerns and questions?”
- “Did the overall customer experience meet your expectations?”
The easier you make it for the customer, the more likely you are to retain them.
How to Use Customer Effort Score?
Distribute a CES survey after customers’ interactions with your Customer Service agent. If the score comes out low, you can use the data to assess the loopholes in your Customer Service and product and work towards making the right improvements so that the customer effort reduces in the long run. This will increase the chances of your customers continuing their business with you in the long run. How to improve the customer effort score? Well, let’s understand this with an example.
For instance, you run an online retail store and offer customers to buy your product via your website and app. Start by taking a look at all the possible touchpoints where the customer interacts with your business. You can ensure that all those touchpoints are optimized to be user-friendly.
Once the customer finds what they need, they should be able to seamlessly checkout. You can assist with this by simplifying payment processes and offering updates about their purchase via email or SMS.
You also need to ensure that your Customer Service channels like live chat, email, phone, or text messages are open for customer communication. All of this can help you in customer solving customer issues quickly and provide an overall seamless experience with your product.
Best for: Measuring how easy or difficult it is for customers to resolve issues, complete tasks, or interact with your support team and product.
15. Customer Satisfaction Score
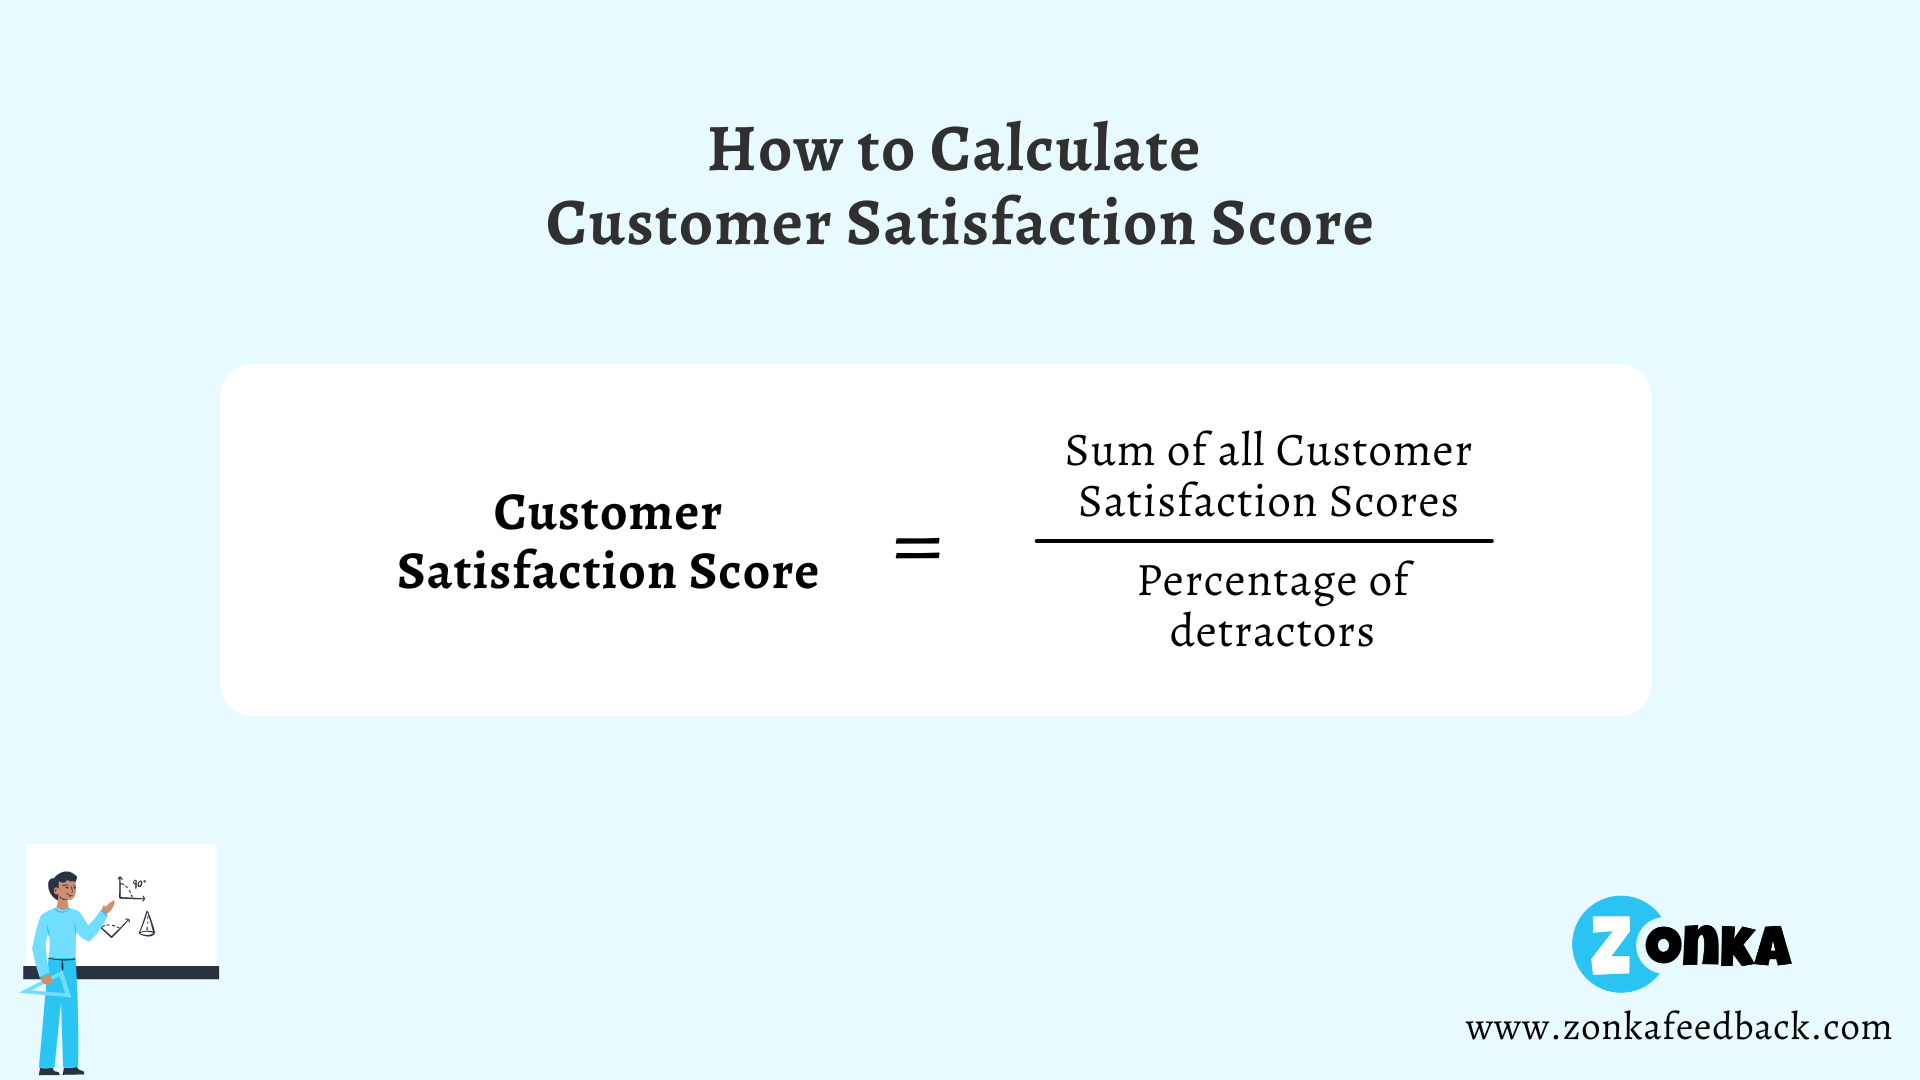
CSAT score is yet another essential Customer Service Metric that can help you track how happy or satisfied customers are with your service or product. CSAT score can be used to measure the feelings of customers immediately after interaction with the Customer Service team or agents.
This survey can be sent along with a CES survey as Likert Scale questions to measure customer satisfaction on a scale of 1-5. To get a better context about the customer’s score, you can follow up with an open-ended question like:
- “Tell us what we can do better”
This can give you a bit more detail about the interaction and customer experience with the service agents.
How to use the Customer Satisfaction Score?
Customer Satisfaction Score can be easily measured by running a CSAT survey as we mentioned before. The results of the survey, if come positive, can tell you where you went right. But a low score can be a result of multiple factors that might need your attention. For this, you can either use survey logic where an answer with a low score gets followed up with a question -
“Sorry for your inconvenience. Can you elaborate on what went wrong?”
You can also use workflows to send follow-up emails to respondents with low CSAT scores and if the issue doesn’t get resolved in a specific time, the ticket goes automatically for escalation for quick query resolution and closing the feedback loop.
Best for: Understanding how satisfied customers are immediately after a support interaction, purchase, or service experience.

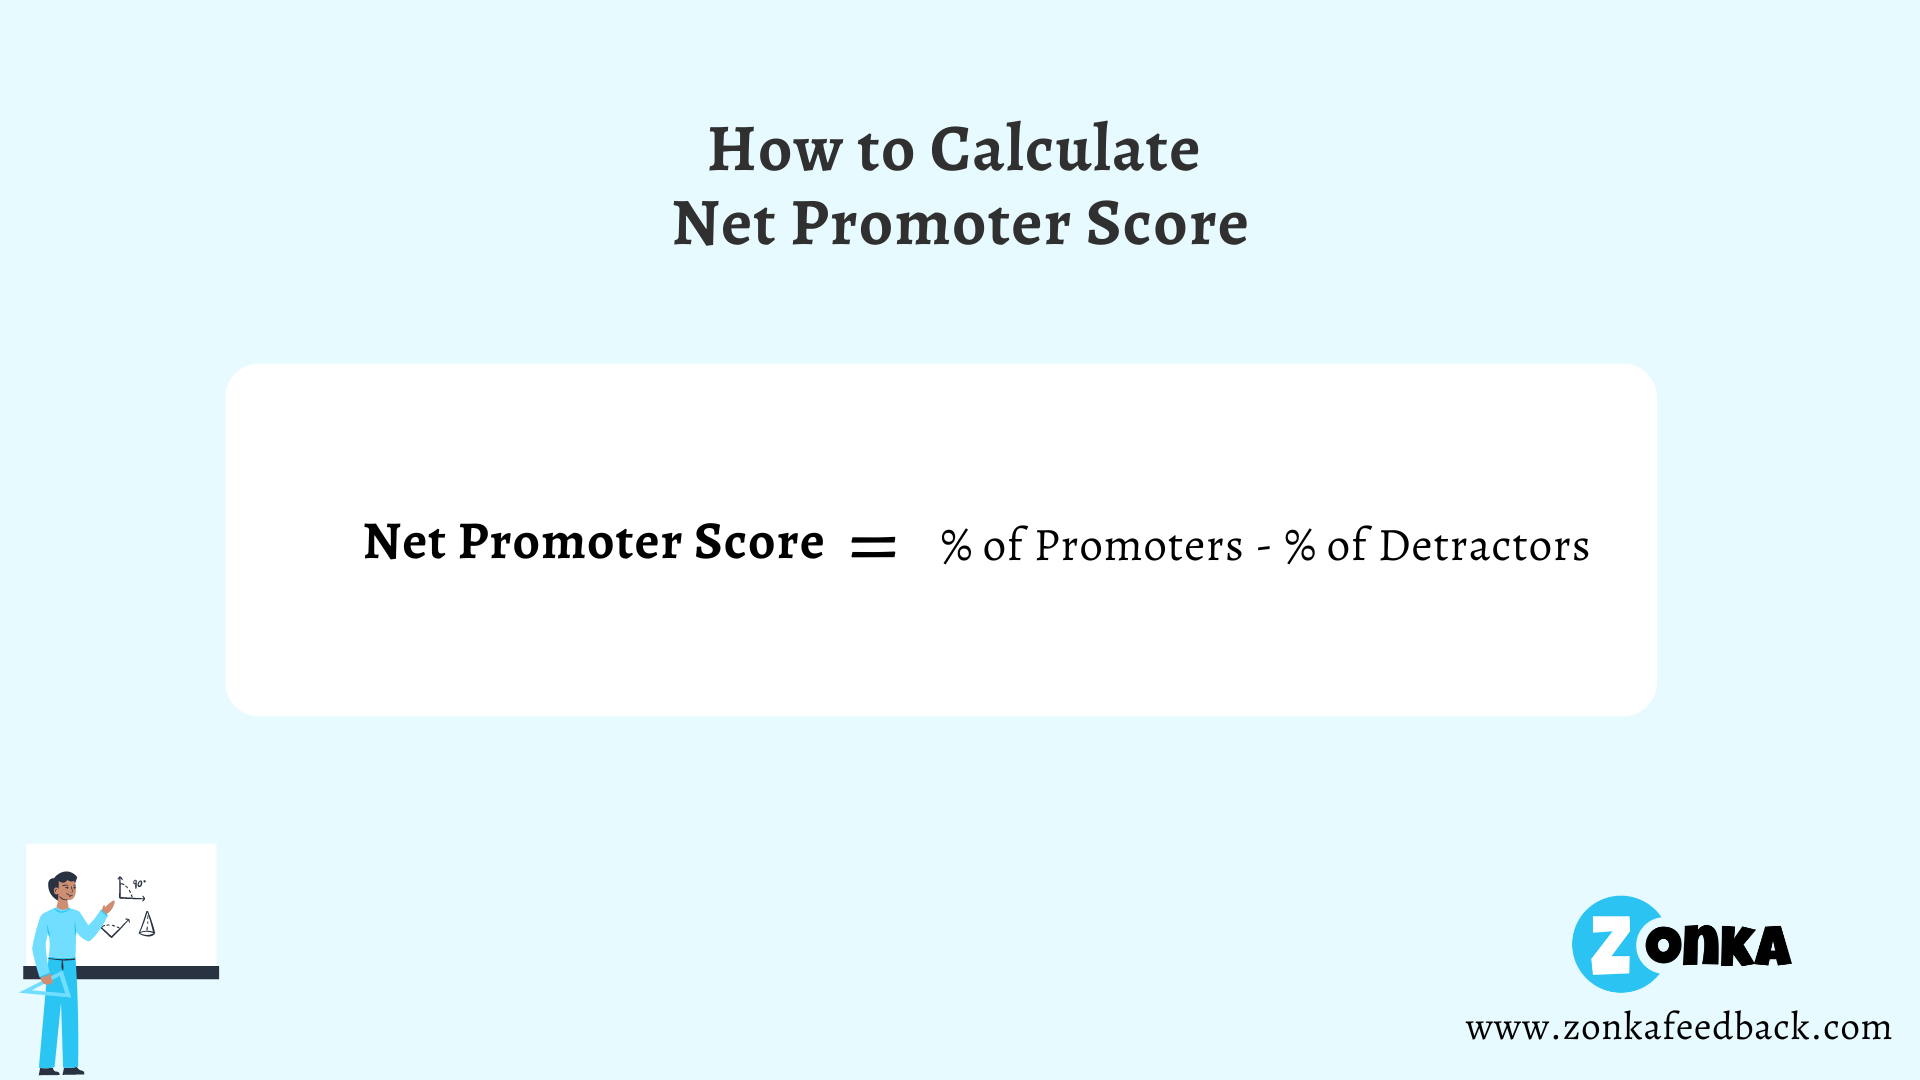
16. Net Promoter Score (NPS)
Other than measuring the customer effort and satisfaction with your product/service, you might also need to check how loyal your customers are and how likely they are to recommend your business to their friends and family.
NPS calculator surveys usually ask one important question that can reveal the overall satisfaction level of a customer with your business and help you segment promoters from detractors. NPS survey followed by an open-ended question like, “What’s the reason behind your answer?” can also give you insight into their decision and give you actionable feedback which you can use to make the improvements to turn detractors into promoters.
How to Use Net Promoter Score?
As we mentioned before, customers can be segmented based on their responses as promoters (9 or 10), passives (7 or 8), and detractors (0 or 6). Promoters are the happy customers who are likely to promote your business, passives might be happy but not enough to promote it and detractors are unhappy ones who are unlikely to advocate for or promote your business.
To measure the NPS score, all you need to do is to subtract the detractors from promoters. A low NPS score means that your product or service needs improvement. You can use the other metrics data to pinpoint the exact issues and make improvements to your product roadmap to enhance your overall customer experience.
Best for: Measuring customer loyalty and identifying how likely customers are to recommend your brand to others.
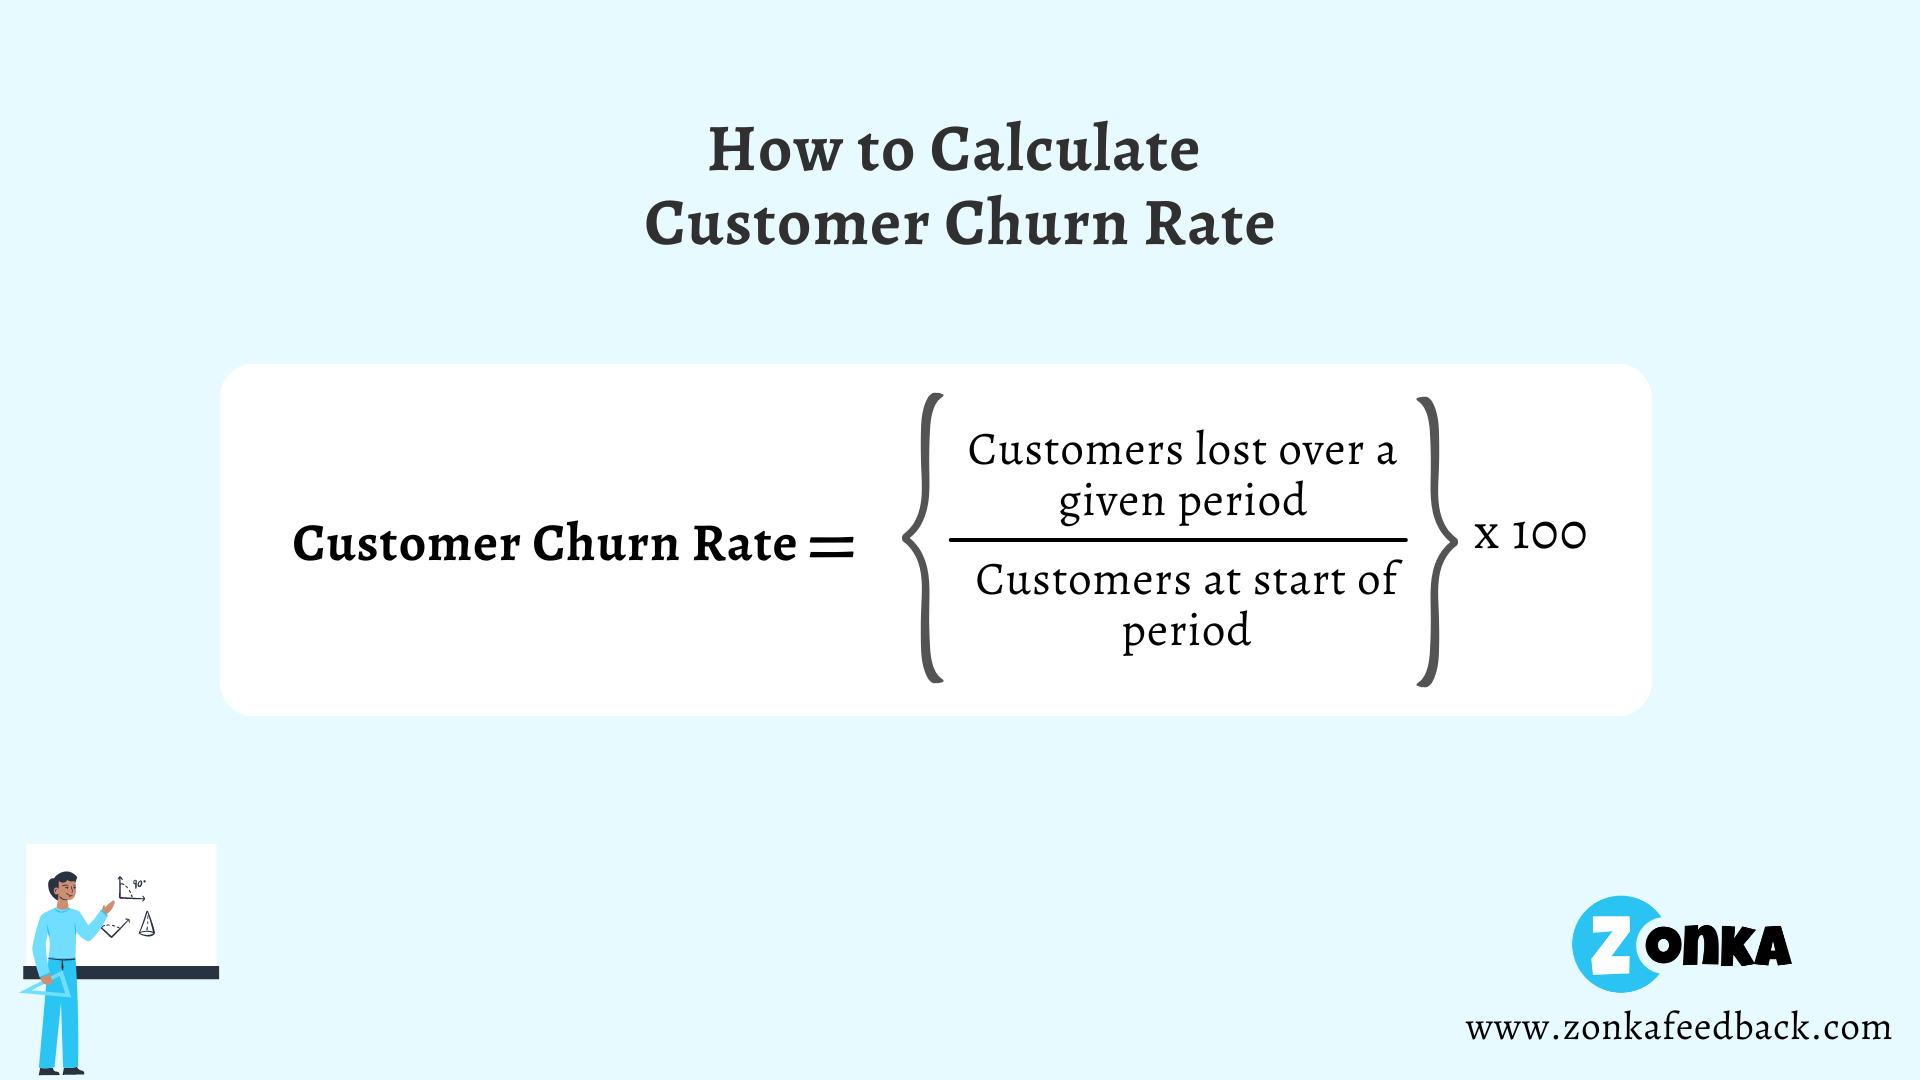
17. Customer Churn
Customers leaving can never be good for any business no matter what. And when you see a rapid decline in your customer base, it can be a reason for worry. That’s why it becomes important to also measure the customer churn metrics. These Customer Service Metrics are calculated at intervals depending on the industry.
For instance, a company that focuses primarily on social media might want to measure customer churn metrics every day. A SaaS company, on the other hand, might want to do it monthly, quarterly, or annually.
How to use Customer Churn Metrics?
Customer Churn could be the result of multiple factors that need to be addressed. By using the data from other Customer Service Metrics, you can get an idea about the reasons behind customer churn and overall customer sentiment. You can further work on retaining the leaving customers by personally getting in touch with them and understanding their problems in deep so that you can make the much-needed improvements to your product or services.
For a customer-centric business, it’s important to manage customer experience. At the end of the day, you only want your customers to be loyal to your business. While Customer Service Metrics can give you the data on where your customer experience is slacking.
You can also implement strategies that help you get a 360-degree view of your customers along with their perception of your brand. There are four critical steps that you can follow to implement a robust strategy. You can read more about it in our blog on Customer Experience Management to get a better idea.
Best for: Tracking customer retention and identifying when and why customers stop doing business with your company.
 Here's a complete list of Customer Service Metrics discussed above.
 Conclusion
No matter how small or big your business is, if your customers aren’t happy then everything you do is basically pointless. It’s important to listen to them and build a relationship. And like any other relationship, this one also requires you to make them feel heard and valued, or else it won’t work.
The best way to grow is by taking agent feedback, measuring the efficiency of your Customer Service tools, and ensuring optimum customer satisfaction. And when you start measuring these Customer Service Metrics, you can set a benchmark for yourself and your support teams so they can work on delivering an outstanding customer experience.
You can start collecting agent feedback and other Customer Service feedback data with Zonka Feedback. We have a plethora of pre-built templates along with automated workflows to streamline and fastrack your feedback collection and management process.
Measure Customer Service Performance
Improve your customer service and grow your business with real-time feedback


_%20Which%20Zendesk%20NPS%20App%20Should%20You%20Choose.svg)


.svg)
%20in%20Zendesk.svg)


