


.svg)
 Healthcare
 Finance
 Retail
 SaaS & Digital
 eCommerce
 Education

 Salesforce
  HubSpot
 Pipedrive
 Mailchimp
 Zendesk
  Freshdesk
 HelpScout
  Front
Front Slack
Slack  Zoom
Zoom Google Sheets
  Zapier
  Integrately
 Webhooks
  Blogs
Blogs Webinar
 Product Updates


TL;DR
- A product market fit survey (also called a PMF survey or Sean Ellis test) asks users one question: "How would you feel if you could no longer use this product?"
- If 40% or more say "very disappointed," you likely have product-market fit. Below 40%, keep iterating.
- Survey 40-50 engaged users who've experienced your core product value in the last two weeks.
- Key follow-ups: main benefit received, ideal user persona, improvement suggestions, acquisition channel.
- Superhuman used this framework to go from 22% to 58% by segmenting users, doubling down on what worked, and addressing what held others back.
You can build the most elegant product. Hire the sharpest team. Raise the funding. But if nobody would miss it when it's gone, none of that matters.
That's the uncomfortable truth behind product-market fit. Not whether people like your product. Whether they need it.
PayPal learned this the hard way. The company started as Confinity, letting users exchange money via PalmPilots, a niche device owned by almost nobody in their target market. Inevitable failure. But when they pivoted to eBay sellers who actually needed a fast payment method, PayPal became a household name. Same team. Same ambition. Different fit.
The question is: how do you know if you have it? And if you don't, how do you find it?
That's where the product market fit survey comes in. It's not a satisfaction poll or an NPS check. It's a specific methodology within the broader product feedback guide toolkit, designed to measure whether your product is a must-have, and what to do if it isn't.
What Is a Product Market Fit Survey?
A product market fit survey (also called a PMF survey, Sean Ellis test, or "very disappointed test") measures one thing: how essential your product is to the people using it.
The methodology comes from Sean Ellis, who led early growth at Dropbox, LogMeIn, and Eventbrite. After working with nearly 100 startups, Ellis noticed a pattern. The companies that struggled to grow almost always had one thing in common. And the companies that broke through had the opposite.
The difference wasn't marketing. Wasn't pricing. Wasn't even product features.
It was this: how users answered one specific question.
The 40% Rule: Why It's the Benchmark
The core question:
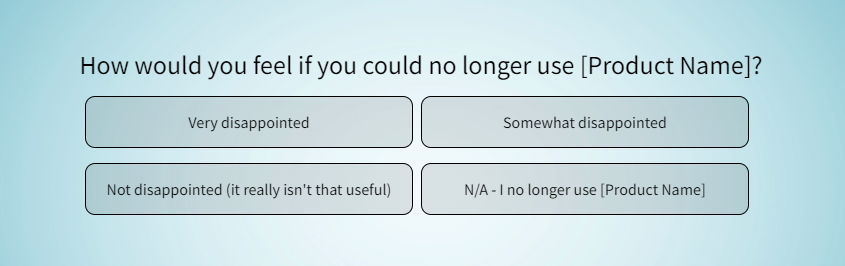
"How would you feel if you could no longer use this product?"
With three answer options:
- Very disappointed
- Somewhat disappointed
- Not disappointed
Ellis found that if 40% or more of users said "very disappointed," the product almost always achieved sustainable growth. If fewer than 40% said it, the product almost always struggled.
That's the 40% rule. Not a vanity metric. A leading indicator.
Why frame the question around disappointment instead of satisfaction? Because disappointment reveals necessity. Asking "Do you like this product?" invites polite, positive-biased answers. Asking "Would you miss it?" surfaces whether the product actually matters.
Slack hit 51% in Hiten Shah's 2015 research study with 731 users. That wasn't surprising in hindsight. Slack had already become indispensable for the teams using it. The survey just confirmed what the retention data was already showing.
The 40% benchmark isn't arbitrary. It emerged from Ellis's observation of what separated companies that scaled from companies that stalled. For a broader look at how PMF scores compare across industries, see our product feedback benchmarks.
How to Calculate Your PMF Score
The formula is simple:
PMF Score = (Very Disappointed Responses / Total Valid Responses) × 100
Example:
- You survey 200 users
- 80 answer "very disappointed"
- PMF Score = (80 / 200) × 100 = 40%
Notes:
- Exclude "N/A — I no longer use it" from the denominator. You're measuring fit among active users, not former ones.
- You start getting directionally correct results around 40-50 responses. You don't need thousands.
Above 40%? Focus on scaling. You have validation that users genuinely need what you've built.
Below 40%? Focus on learning. The survey tells you there's a gap. The follow-up questions tell you where.
Case Study: How Superhuman Reached 58% PMF
Rahul Vohra's Superhuman is the canonical product-market fit survey success story. Not because they started with fit — they didn't. Because they used the framework to systematically find it.
Starting point (summer 2017): 22% "very disappointed"
That's well below the 40% threshold. Most founders would have panicked. Vohra did something smarter: he segmented.
Step 1: Segment to find the supporters
Instead of treating all survey respondents equally, Vohra filtered down to just the "very disappointed" group and asked: who are these people?
The answer: founders, managers, executives, business development professionals. A specific subset of Superhuman's users, not the entire base.
When he recalculated the PMF score for just this segment? It jumped to 33%. Still below 40%, but closer. With minimal product changes. Just a tighter definition of who the product was for.
Step 2: Understand what they loved
The follow-up question "What is the main benefit you receive from Superhuman?" revealed clear patterns. Speed. Keyboard shortcuts. The ability to process email faster than any other client.
These weren't features Superhuman should water down for broader appeal. These were the things to double down on.
Step 3: Understand what held others back
The "somewhat disappointed" users who valued speed but weren't fully converted had a clear blocker: no mobile app. Superhuman had started with desktop only. By 2017, that was holding back fit.
Other requests: integrations, better calendar features, unified inbox, read receipts.
Step 4: Split the roadmap
Half the roadmap went to doubling down on what "very disappointed" users loved: more speed, more shortcuts, more automation, more design polish.
Half went to addressing what held "somewhat disappointed" users back: mobile app, integrations, calendar features.
Result: Within three quarters, Superhuman's PMF score nearly tripled: from 22% to 58%.
The framework worked because it wasn't guessing. It was listening to users who already loved the product, understanding why, and building more of that.
Essential PMF Survey Questions
The core question is the anchor. But you need follow-ups to know what to do with the results.
The Core Question
"How would you feel if you could no longer use [product]?"
- Very disappointed
- Somewhat disappointed
- Not disappointed
- N/A — I no longer use it
This is the question. Word it exactly this way. Minor phrasing changes affect results, and you want to benchmark against the same standard other companies use.
Follow-Up Questions (Run These Every Time)
1. What type of person would benefit most from this product?
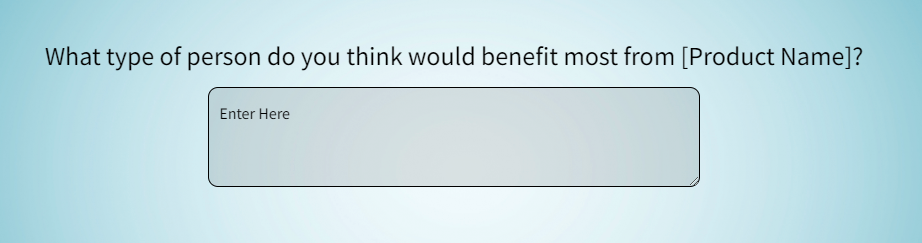
Happy users describe themselves. They use the words that matter most to them. This question reveals your ideal customer persona, and gives you language for your positioning.
One of the insights Vohra got from Superhuman users: "busy professionals who deal with many people." That became the foundation of their High-Expectation Customer (HXC) profile.
2. What is the main benefit you receive from this product?
This clarifies your actual value proposition. Not what you think you're selling. What users think they're buying.
Word cloud the responses. Patterns emerge fast. Superhuman's users kept saying "speed" and "keyboard shortcuts." That wasn't marketing copy. It was the product's core.
3. How can we improve the product to better meet your needs?
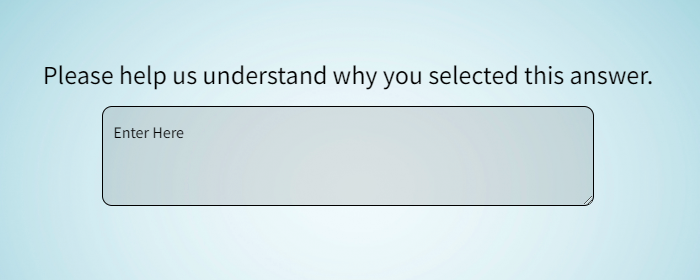
This question matters most for the "somewhat disappointed" segment. They're close to loving your product. Something's holding them back. This question tells you what.
Superhuman learned about mobile, integrations, and calendar features here. The exact blockers they needed to address.
4. How did you discover this product?
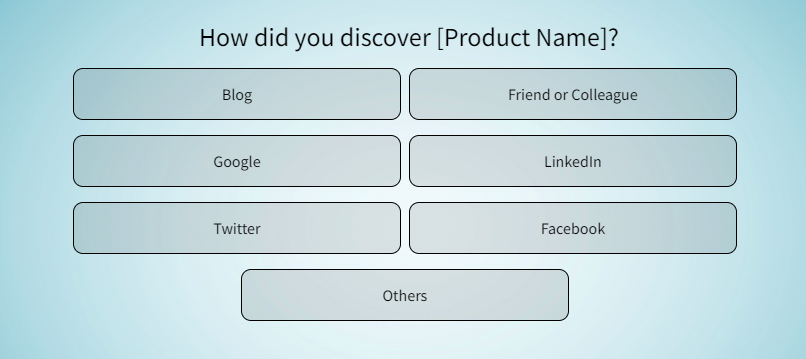
Acquisition channel insight. If most "very disappointed" users came from a specific channel, double down on that channel. You're not just finding fit. You're finding where to find more users like the ones who already fit.
5. What would you use as an alternative?
Instant competitive intelligence. Users will name the alternatives they've considered or used. You learn your competitive set from the people who've actually evaluated it.
6. Have you recommended this product to anyone?

This segments users into promoters and non-promoters. You can also replace this with a full NPS question if you want a more granular loyalty measure.
For general product feedback questions beyond PMF measurement, see our full question bank.
PMF Survey Sample Size: How Many Responses Do You Need?
You don't need thousands of responses to get signal.
Hiten Shah's guidance: 40-50 quality responses give you directionally meaningful results. More is better for segmentation, but you can make decisions at 40.
The key isn't volume. It's targeting the right users:
- Used the product at least twice in the last two weeks. Recent experience, not distant memory.
- Experienced the core product value. Someone who signed up but never activated isn't useful for this survey.
- In your target segment. If you got press and attracted a bunch of drive-by signups, don't survey them. They're not your audience.
The goal is signal, not statistical significance. You're not publishing a paper. You're making product decisions.
When to Run a PMF Survey
Run a PMF survey when:
You're seeing slower growth than expected. The survey tells you if it's a fit problem or a distribution problem. Below 40%, it's fit. Fix the product before pouring money into marketing.
Before raising funding. Investors will ask about product-market fit. Having a number, and a plan for improving it, is better than having a vague "users love us" claim.
After launching a significant feature. Did the new feature move the needle? Running the survey before and after tells you. The same applies after a beta testing survey cycle, where PMF measurement confirms whether the beta changes moved you closer to fit.
Quarterly, as an ongoing practice. PMF isn't a one-time milestone. It can erode as you add features, expand to new segments, or face new competitors. Superhuman still tracks their score regularly.
During A/B testing or positioning changes. The survey becomes a dependent variable. Did the change improve fit for your target segment?
For broader product idea validation with feedback, PMF surveys are one method among several. Use PMF specifically to measure whether you've achieved fit, not just initial interest. And for the full picture on how PMF surveys fit into your product feedback strategy, that guide covers the broader framework.
How to Analyze PMF Survey Results
Getting responses is the easy part. Knowing what to do with them is where most teams stall.
Step 1: Calculate Your Score
Use the formula. Benchmark against 40%.
Step 2: Segment the "Very Disappointed" Group
Don't just count them. Study them.
- What personas appear most frequently?
- What did they say is the main benefit?
- How did they find you?
These are your High-Expectation Customers. The people who already love what you've built. Everything you do next should either serve them better or find more people like them.
Step 3: Analyze the "Somewhat Disappointed" Group (Carefully)
This group is tricky. Some of them are one feature away from becoming advocates. Some will never get there no matter what you build.
The filter: do they value your main benefit?
Superhuman filtered for "somewhat disappointed" users who mentioned speed as a key value. These users appreciated the core. Something just held them back. Their feedback was worth acting on.
"Somewhat disappointed" users who didn't care about speed? Politely ignored. They weren't the target.
Step 4: Politely Disregard "Not Disappointed" Users
This sounds harsh. It's practical.
Users who wouldn't miss your product are too far from fit to inform your roadmap. If you chase their feedback, you'll mangle your product trying to please people who were never going to love it.
They'll request distracting features. They'll present ill-fitting use cases. They'll be vocal. And then they'll churn anyway.
Focus your energy on the users who are already close.
Step 5: Build a Roadmap From the Data
The Superhuman formula:
- 50% of roadmap: double down on what "very disappointed" users love
- 50% of roadmap: address what holds "somewhat disappointed" users (who share your core value) back
This isn't guessing. It's listening to the people who matter most and building what they've already told you they need. For a deeper look at how survey insights should feed directly into your product roadmap with customer feedback, that guide covers the mechanics.
Above 40%?
You have fit. Focus on scaling: marketing, sales, growth. Keep running the survey quarterly to ensure you maintain fit as you add features and expand to new segments.
Below 40%?
You don't have fit yet. But you have data.
Segment to find where you DO have fit. Maybe it's a specific persona, company size, or use case. Narrow down, serve that segment better, and expand from strength.
For more on what happens after the survey, see our guide on closing the customer feedback loop. And to understand how these insights feed into a continuous improvement cycle, the product feedback loop explains the full mechanics.
PMF Survey Templates (Ready to Use)
Don't build from scratch. These templates include the core question and recommended follow-ups:
- Sean Ellis PMF survey template: The classic 4-question format used by Superhuman, Slack, and hundreds of startups.
- Product-market fit template: Extended version with segmentation fields and analysis-ready structure.
Both work with Zonka Feedback's product feedback software. Trigger them in-app, via email, or through a link. Responses sync to your dashboard for analysis.
Common Mistakes After Running a PMF Survey
1. Below 40%? Don't Despair. Iterate.
A low score isn't a death sentence. It's information.
Segment. Find where you have strength. Double down there. Iterate. Re-run the survey. Track progress.
PayPal was below any reasonable fit threshold when they were selling to PalmPilot users. The pivot to eBay sellers changed everything.
2. Above 40%? Don't Overspend
A high score can create its own problems.
Teams see strong PMF results and immediately hire aggressively, increase marketing spend, expand to new markets. Then they discover their infrastructure wasn't ready for scale.
The score tells you THAT you can grow. It doesn't tell you HOW FAST you can grow without breaking things.
3. No Go-to-Market Strategy
PMF score alone doesn't tell you how to scale.
You need to measure:
- Value Fit: Does your positioning resonate? (Track with NPS and CSAT)
- Purchaser Fit: Will people actually pay? (Track with CES and conversion data)
- Distribution Fit: Can you reach them efficiently? (Track acquisition cost by channel)
The PMF survey is one input. Not the whole picture.
Scaling After Product-Market Fit: Low-Touch vs High-Touch Models
Most PMF content stops at "hit 40%, then scale." That's incomplete. HOW you scale depends on your business model.
Low-Touch Model
Self-onboarding. High volume. Low ticket size. Digital engagement drives adoption.
Slack, Atlassian, Basecamp: all low-touch. Users sign up, experience value, and upgrade without talking to a human. For SaaS companies pursuing this model, product-led growth with customer feedback covers how feedback loops drive PLG scaling.
VMware's billion-dollar lesson
VMware had two server products in 2002. GSX Server (low-touch) sold well. ESX Server (high-touch) landed just 70 customers in its first year.
The fix? They repositioned ESX as an add-on in existing HP and IBM channel deals. Smaller deals. Lower friction. Low-touch distribution.
The result: $1 billion in sales. From $350,000 in year one.
Fit existed. Distribution was the problem. Switching to low-touch made the growth happen.
High-Touch Model
Enterprise accounts. Low volume. High ticket size. Direct sales. Implementation support.
This works when adoption costs are high. When customers need configuration, training, or integration before they can extract value.
Delphix's high-touch pivot
Delphix started with self-service and channel distribution. Low-touch. But their database virtualization product required significant configuration for each deployment.
The result: slow sales. High friction.
They switched to direct sales targeting substantial base deployments with full implementation support. High-touch fit their product's complexity.
Sales accelerated immediately.
The point: your PMF score tells you IF you can scale. Your GTM model tells you HOW.
Conclusion
The product market fit survey isn't a formality. It's a diagnostic.
Run it honestly. Survey the right users. Segment the results. Build your roadmap from what the data tells you, not from what you hoped it would say.
If you're above 40%, you have permission to scale. Do it carefully.
If you're below 40%, you have work to do. The survey tells you where to focus.
Either way, you're not guessing anymore.
Next Steps
- Run your first PMF survey → Sean Ellis PMF survey template
- Calculate your score → Aim for 40%+
- Segment your results → Find your High-Expectation Customers
- Build your roadmap → 50% double-down, 50% address blockers
- Re-run quarterly → Track progress over time


