


.svg)
 Healthcare
 Finance
 Retail
 SaaS & Digital
 eCommerce
 Education

 Salesforce
  HubSpot
 Pipedrive
 Mailchimp
 Zendesk
  Freshdesk
 HelpScout
  Front
Front Slack
Slack  Zoom
Zoom Google Sheets
  Zapier
  Integrately
 Webhooks
  Blogs
Blogs Webinar
 Product Updates


The best survey analysis software in 2026 includes Zonka Feedback, Thematic, Chattermill, Sentisum, and Qualtrics. These platforms use AI, natural language processing, and statistical models to turn raw survey responses into structured themes, sentiment trends, and prioritized recommendations, replacing manual tagging and spreadsheet exports.
TL;DR
- Survey analysis software uses AI and NLP to turn raw survey responses into themes, sentiment scores, and prioritized actions.
- This guide covers 12 tools across four categories: AI-powered intelligence, enterprise analytics suites, statistical and BI tools, and conversational survey platforms.
- Tools are evaluated on AI text analysis depth, statistical capabilities, dashboard usability, automation, integrations, and verified G2 ratings.
- Zonka Feedback leads for AI-powered analysis with closed-loop action. Thematic and Chattermill excel at open-text analysis at enterprise scale. Displayr and Tableau are built for statistical rigor.
- A decision framework helps you match the right tool to your team size, survey volume, and analysis complexity.
Your team already sends NPS surveys, collects CSAT scores, and asks for post-interaction feedback. But when a strategic decision comes up, you're still relying on gut feeling instead of pointing to data.
That's not a collection problem. It's an analysis problem.
Most survey responses sit in dashboards no one checks: fragmented, delayed, and ignored until the next churn report drops. And manual feedback analysis compounds the problem: teams reading thousands of verbatims line by line, tagging responses by hand, and still missing the patterns that matter.
This guide compares 12 survey analysis software platforms worth evaluating in 2026: what they do well, who they're built for, and how they stack up on the capabilities that matter for turning survey data into decisions.
What Is Survey Analysis Software?Survey analysis software is any platform that helps teams interpret, organize, and extract meaning from survey responses, turning raw data into patterns your team can act on.
Traditional survey analysis meant exporting CSV files, building pivot tables, and manually reading open-ended responses one by one. That approach breaks when your volume exceeds a few hundred responses or when you need to compare results across time periods, segments, or channels.
Modern survey analysis tools handle three jobs: they structure quantitative data (scores, ratings, multiple choice) into filterable dashboards, they analyze qualitative data (open-ended text) using AI and NLP to surface themes and sentiment, and they connect both to business metrics like NPS, CSAT, and churn so you can see what's driving the numbers.
If you're still figuring out how you'll collect that data in the first place, see our guide to the tools to collect and analyse customer feedback your team already has in place.
What Are the Main Types of Survey Analysis Methods?
Not all survey analysis is the same. Understanding what type of analysis your team actually needs shapes which tool to pick.
Thematic Analysis
Thematic analysis identifies recurring topics and patterns across open-ended survey responses. AI-powered platforms automatically cluster verbatims into themes, "pricing concerns," "onboarding friction," "feature gaps", without manual coding. For teams doing this at scale, dedicated thematic analysis software handles the taxonomy automatically.
Sentiment Analysis
Sentiment analysis scores the emotional tone behind responses, positive, negative, or neutral, at the response, sentence, or theme level. A response can be positive about support but negative about billing. Basic sentiment tools miss that split. The distinction matters for tool selection, and both methods work best together.
Statistical and Quantitative Analysis
Cross-tabulation, significance testing, regression, and correlation analysis for scores and ratings. This is the domain of market researchers who need to validate patterns across demographic segments, survey waves, or geographic splits with statistical significance testing.
Driver Analysis
Driver analysis identifies which themes most influence a specific metric, NPS, CSAT, or churn rate. It's the difference between knowing what customers say and knowing what actually moves the needle.
Mixed Methods
Most CX teams need both: qualitative data for understanding the "why" and quantitative data for tracking the "what." The best survey analysis platforms handle both in one view.
How to Analyze Survey Data: A Step-by-Step Process
Survey analysis follows the same sequence regardless of tool or volume.
Step 1: Define your analysis objective
Before touching a single response, decide what question you're answering. "What's driving our NPS drop?" is a different analysis than "What features should we build next?" The objective determines which data you filter for and what counts as a meaningful finding.
Step 2: Clean and segment your response data
Remove incomplete responses, filter out test submissions, and segment by the variables that matter, account tier, cohort, region, or date range. Raw exports almost always have noise that skews results if left in.
Step 3: Analyze quantitative data
Start with scores and ratings. Calculate distributions, averages, and trend lines. Run cross-tabulations to see how satisfaction varies across segments. Flag statistically significant differences, a 3-point NPS gap between regions matters; a 0.2-point difference probably doesn't.
Step 4: Analyze open-ended responses
This is where most analysis stalls. Manual reading doesn't scale past a few hundred responses. AI-powered tools detect themes, sentiment, and intent automatically. A solid grounding in qualitative data analysis helps frame what good analysis looks like before you pick a platform.
Step 5: Connect themes to business metrics
Theme frequency tells you what customers say. Driver analysis tells you what's actually moving your scores. Prioritize themes by impact, not volume.
Step 6: Route findings and close the loop
Analysis that doesn't reach the person who can act on it is just reporting. Route insights to product, support, or CX owners. Track whether the actions taken actually moved the metrics.
What Types of Survey Analysis Tools Exist?
Survey analysis platforms fall into four categories. Most tools overlap, but understanding the primary focus helps narrow down which type fits your workflow.
1. AI-Powered Survey Intelligence Platforms
Use NLP and machine learning to analyze open-ended survey responses automatically, detecting themes, sentiment, intent, and anomalies without manual tagging. For a broader market view, see our guide to the top AI-powered feedback analysis tools in 2026. Examples: Zonka Feedback, Thematic, Chattermill, Sentisum, Convin.ai.
2. Enterprise Survey Analytics Suites
Full-stack platforms handling survey creation, distribution, and analysis with enterprise-grade governance, role-based access, and advanced analytics modules. Examples: Qualtrics, SurveyMonkey.
3. Statistical and BI Survey Analysis Tools
Purpose-built for researchers and analysts who need cross-tabulation, significance testing, regression analysis, and advanced data visualization. Examples: Displayr, Tableau.
4. Conversational and Flexible Survey Platforms
Survey builders prioritizing response quality through conversational design, with built-in analysis dashboards ranging from basic to moderate. Examples: Typeform, Pollfish, Alchemer.
What Features Should You Look For in Survey Analysis Software?
Your analysis complexity determines the right features.
- AI-Powered Text Analysis: Theme detection, sentiment scoring, and intent classification for open-ended responses. This separates modern survey analysis from manual spreadsheet tagging.
- Statistical Analysis: Cross-tabulation, significance testing, and correlation analysis for quantitative survey data. Critical for research teams.
- Real-Time Dashboards: Filterable views that let you slice survey results by segment, time period, or channel without waiting for weekly reports.
- Automated Reporting: Scheduled or triggered reports that summarize findings and push them to the right teams.
- Closed-Loop Workflows: Route negative survey responses to owners, trigger follow-up actions, and track resolution.
- KPI Correlation: Connecting survey data to NPS, CSAT, CES, churn, or revenue to see which themes are moving the numbers.
- Multi-Source Data Ingestion: Analyzing survey data alongside support tickets, reviews, and chat transcripts.
- Integrations: Native connections to your CRM, helpdesk, BI tools, and collaboration platforms.
When evaluating tools, start by auditing tools to collect and analyse customer feedback already in your stack, then treat software to extract themes and sentiment from open-text feedback as a baseline capability. Anything below that standard leaves the richest survey data unanalyzed.
How Do You Choose the Right Survey Analysis Software?
Start with your biggest analysis bottleneck, not a feature checklist.
| Your Situation | What to Prioritize | Tool Type | |
| A | Thousands of open-text responses you can't read manually | AI theme detection, sentiment analysis, automated tagging | AI-Powered Intelligence |
| B | Enterprise survey programs with governance and multi-team access | Role-based reporting, text analytics module, compliance | Enterprise Suite |
| C | Need statistical rigor: significance tests, cross-tabs, regression | Advanced statistical methods, data import, visualization | Statistical / BI Tool |
| D | Low response rates are the primary problem | Conversational design, conditional logic, multi-channel distribution | Conversational Platform |
Beyond use case, weigh these factors:
- Survey volume: 500 responses a month is a different problem than 50,000. Pricing, performance, and AI accuracy all scale differently.
- Analysis depth: Do you need simple charts and filters, or cross-tabulation with significance testing? Not every team needs statistical analysis.
- Budget: Enterprise platforms like Qualtrics can run $50K+/year. AI-powered alternatives offer comparable analysis depth at more accessible pricing.
- Integration requirements: If your CRM is Salesforce and your helpdesk is Zendesk, native integrations matter more than feature count. For teams tracking satisfaction metrics, it's worth evaluating CSAT survey platforms with AI analysis and closed-loop workflows before committing to a standalone analytics platform.
How Did We Evaluate These Survey Analysis Tools?
We build Zonka Feedback, so it's fair to say that upfront. That said, this guide is designed to be practical and balanced.
| Criterion | Weight | What We Assessed |
| AI and Text Analysis | 25% | Theme detection accuracy, sentiment analysis, intent classification, AI summaries |
| Quantitative Analysis | 20% | Cross-tabs, filtering, segmentation, significance testing, KPI correlation |
| Dashboards and Usability | 15% | Clarity of reporting, how quickly teams can interpret results, role-based views |
| Automation | 15% | Automated tagging, alert triggers, feedback routing, closed-loop workflows |
| Integrations | 15% | Native CRM, helpdesk, BI, and collaboration platform connections |
| Verified Reviews | 10% | G2 and Capterra ratings and qualitative review feedback |
When we analyzed over 1M+ open-ended feedback responses internally, we found 29% carry mixed sentiment, positive about one aspect, negative about another. That finding shaped how we evaluated tools. Platforms that assign a single sentiment score per response miss nearly a third of the signal.
What Are the Best Survey Analysis Software Platforms in 2026?
Here's how the 12 tools compare at a glance:
| Tool | Category | Standout Feature | Best For | Pricing | G2 Rating |
| Zonka Feedback | AI Intelligence | Five-signal detection at response and theme level | AI survey analysis with closed-loop action | Custom; 14-day free trial | 4.7/5 |
| Thematic | AI Intelligence | Driver analysis linking themes to NPS/CSAT impact | Deep open-text analysis with human-guided taxonomy | Custom enterprise | 4.8/5 |
| Chattermill | AI Intelligence | Multi-source unification across surveys, tickets, reviews | Enterprise VoC with unified feedback intelligence | Custom enterprise | 4.5/5 |
| Sentisum | AI Intelligence | AI root-cause analysis beyond sentiment and topic tagging | Support-heavy teams with high-volume feedback | From ~$3,000/mo | 4.8/5 |
| Convin.ai | AI Intelligence | 100% conversation audit across calls, chats, and emails | Contact centers analyzing interactions alongside survey data | Custom | 4.7/5 |
| SurveyMonkey | Enterprise Suite | AI sentiment analysis with industry benchmarks | Self-serve survey creation and analysis in one tool | From $30/user/mo | 4.4/5 |
| Qualtrics | Enterprise Suite | Text iQ + Stats iQ for qualitative and statistical analysis | Enterprise survey programs with governance needs | Custom enterprise | 4.4/5 |
| Displayr | Statistical / BI | Automated cross-tabs with significance testing | Research teams needing statistical rigor from survey data | Annual plans; contact for pricing | 4.3/5 |
| Tableau | Statistical / BI | Survey data alongside CRM, revenue, and product metrics | Analyst teams building custom multi-source dashboards | From $75/user/mo | 4.4/5 |
| Typeform | Conversational | Conversational survey design with higher completion rates | Teams fixing low response rates with basic analysis needs | From $25/mo | 4.5/5 |
| Pollfish | Conversational | Global respondent panels with real-time analysis | Market research teams needing audience access | Pay-per-response from ~$0.95 | 4.3/5 |
| Alchemer | Conversational | Flexible survey logic with workflow automation | Mid-market teams needing structured analysis without enterprise cost | From $55/user/mo | 4.4/5 |
AI-Powered Survey Intelligence Platforms
These tools use NLP and machine learning to analyze open-ended survey responses at scale, detecting themes, sentiment, intent, and anomalies without manual tagging.
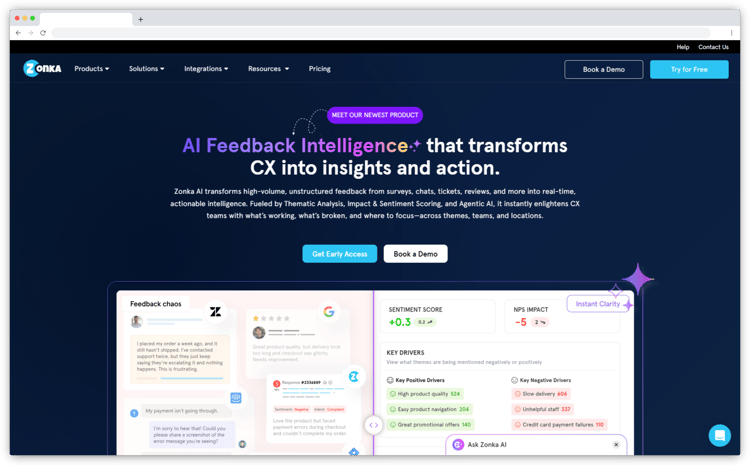
1. Zonka Feedback: Best for AI Survey Analysis with Closed-Loop Action
G2 Rating: 4.7/5
Zonka Feedback's AI Feedback Intelligence module is built for teams drowning in survey verbatims. It ingests open-ended responses from NPS, CSAT, and CES surveys, plus support tickets, reviews, and chat transcripts, then runs every response through thematic analysis, sentiment scoring, and intent classification automatically.
Where most survey analysis tools assign one sentiment score per response, Zonka detects five experience signals per theme: sentiment, emotion, urgency, effort, and churn risk. When we analyzed 1M+ open-ended feedback responses, 29% carried mixed sentiment. Zonka treats those as separate signals rather than blending them into one score. Entity recognition maps mentions to specific products, agents, or locations. Intent classification auto-routes complaints to support, feature requests to product, and advocacy signals to marketing through automated closed-loop workflows.
Key Features
- Five-Signal Detection at Response and Theme Level: Sentiment, emotion, urgency, effort, and churn risk measured per theme within each response, catching mixed sentiment that overall scoring misses.
- Auto-Evolving Thematic Taxonomy: AI discovers themes and sub-themes across survey responses. The taxonomy persists and updates as new patterns emerge.
- Entity Recognition: Maps survey mentions to specific products, agents, locations, or competitors for filtered, attributable analysis.
- Role-Based Dashboards: CX leaders, product teams, and support each get filtered views relevant to their decisions.
Zonka Feedback Pros
- Deepest signal detection in this list, five signals per theme, not one score per response
- Analysis connects directly to closed-loop action: alerts, tasks, and CRM updates
Zonka Feedback Cons
- Voice/call analysis not yet supported natively
- Advanced AI features require higher-tier plans
Zonka Feedback Pricing
Custom pricing based on survey volume. 14-day free trial available on request.
2. Thematic: Best for Theme-to-Metric Impact Analysis
G2 Rating: 4.8/5
Thematic is built for CX and insights teams that need to understand not just what customers are saying, but which themes are moving their NPS or CSAT scores. Its standout capability is driver analysis, connecting theme frequency directly to metric impact so teams can prioritize by business effect, not just volume.
The human-in-the-loop theme editor lets analysts refine AI-generated categories, merge themes, and build a taxonomy that matches how their business actually thinks. That makes findings more credible to stakeholders skeptical of black-box AI. Brands like Atlassian and DoorDash use it for explainable insights, with an AI-powered search bar that answers questions like "What changed in our NPS last month?" For teams evaluating standalone options, see our full guide to tools to automatically detect themes in customer feedback. Thematic is analytics-only: it doesn't collect surveys or close the feedback loop.

Key Features
- Human-in-the-Loop Theme Editor: AI identifies themes; analysts refine through a visual editor for business-aligned taxonomy.
- Driver Analysis: Linking themes directly to NPS/CSAT impact so teams can prioritize by business effect.
- AI-Powered Search: Ask plain-language questions and get instant AI summaries backed by survey data.
- Verbatim Drilldown: Click any theme to view the exact survey responses that formed it.
Thematic Pros
- AI combined with human refinement produces highly reliable, business-relevant themes
- Clean interface that non-analysts can navigate without training
Thematic Cons
- Analytics-only: no survey collection or loop-closure workflows
- Custom enterprise pricing puts it out of reach for smaller teams
Thematic Pricing
From $25,000/year. Custom enterprise pricing based on volume.
3. Chattermill: Best for Unified Survey and Multi-Channel Feedback Intelligence
G2 Rating: 4.5/5
Chattermill's value for survey analysis is context. It doesn't analyze NPS responses in isolation, it brings survey data together with support tickets, app reviews, social mentions, and chat logs into one AI-powered view. When NPS drops, Chattermill shows whether the same themes are surfacing in support tickets and reviews, confirming the signal is real.
Used by Uber, HelloFresh, and Amazon, it's built for enterprises processing massive feedback volumes across channels and languages. For teams building a comprehensive platforms to build and run a Voice of Customer program, Chattermill integrates with the collection and ticketing systems those teams already use. Real-time alerts, role-specific dashboards, and drillable verbatims mean each function can self-serve insights without waiting for analyst reports.

Key Features
- Multi-Channel Ingestion: Connects surveys with support platforms, reviews, chat logs, and social media into one VoC dataset.
- AI Theme and Sentiment Clustering: Groups survey responses by theme and sentiment with industry-specific language models.
- Real-Time Alerts: Notifies teams when survey sentiment dips or complaint themes spike.
- Multilingual Analysis: Supports survey analysis across 100+ languages at enterprise scale.
Chattermill Pros
- Analyzes survey data in context alongside all other feedback sources
- Enterprise-grade security and dedicated onboarding support
Chattermill Cons
- UI has a learning curve; some features require onboarding time
- Enterprise-tier pricing only, not suited for small teams
Chattermill Pricing
Custom enterprise pricing based on volume and integrations.
4. Sentisum: Best for AI Root-Cause Analysis of Support and Survey Feedback
G2 Rating: 4.8/5
Sentisum is an AI-native VoC platform that unifies feedback from surveys, support tickets, chat logs, and reviews into one continuously updated intelligence layer. For a full comparison of standalone options, see our guide to the best sentiment analysis tools for customer feedback. Its machine learning models go beyond topic tagging, they identify root causes within open-ended feedback, so teams know not just that customers are frustrated with billing, but specifically what in the billing flow triggers complaints.
Trusted by Ticketmaster, Gousto, and Schuh, Sentisum is strong for support-heavy teams where survey verbatims are one input alongside thousands of daily support interactions. Kyo, its AI agent, answers plain-English questions about feedback data with numbers, root causes, and suggested next actions. It integrates natively with Zendesk, Intercom, and Freshdesk.
Key Features
- AI Root-Cause Analysis: Goes beyond surface sentiment and topic tagging to identify what specifically drives complaints.
- Kyo AI Agent: Natural language queries across unified feedback data with numbers, root causes, and next actions.
- Real-Time Dashboards: Anomaly detection for emerging issues before they escalate.
- Native Integrations: Connects with Zendesk, Intercom, Freshdesk, and major survey platforms.
Sentisum Pros
- Among the highest theme detection accuracy in this category
- Dedicated customer success team with hands-on taxonomy setup support
Sentisum Cons
- Pricing starts at ~$3,000/month, not suited for small teams or occasional use
- Primarily designed for support operations; less suited for standalone survey programs
Sentisum Pricing
Pro plan from ~$3,000/month. Custom enterprise pricing available.
5. Convin.ai: Best for Analyzing Customer Conversations Alongside Survey Data
G2 Rating: 4.7/5
Convin.ai is an AI-powered conversation intelligence platform built for contact centers. It analyzes 100% of customer calls, chats, and emails, automatically scoring interactions, detecting sentiment, and identifying coaching opportunities across agents. For teams that collect post-interaction survey data, Convin connects what customers say in surveys to what actually happened during the call.
Trusted by Titan and Asian Paints, Convin handles multilingual conversation analysis across 70+ languages and integrates with major contact center and CRM platforms. Its automated quality assurance replaces random sampling with full-coverage analysis. The Convin Insights module surfaces recurring complaint patterns across interactions that no survey could capture on its own.
Key Features
- Automated Quality Assurance: 100% coverage across calls, chats, and emails, replacing random sampling.
- AI Sentiment and Intent Detection: During and after customer interactions across 70+ languages.
- Convin Insights: Cross-interaction pattern detection for recurring complaint themes.
- Real-Time Agent Assist: Live guidance and post-interaction coaching tools.
Convin.ai Pros
- Covers what surveys can't: the actual content of customer conversations
- Multilingual support across 70+ languages for global contact centers
Convin.ai Cons
- Primarily a conversation intelligence tool, not a standalone survey analysis platform
- Integration with survey platforms requires custom configuration
Convin.ai Pricing
Custom pricing. Contact for a quote.
Enterprise Survey Analytics Suites
Full-stack platforms for organizations running large-scale survey programs with governance, role-based access, and built-in analytics modules.
6. SurveyMonkey: Best for Self-Serve Survey Creation and Analysis
G2 Rating: 4.4/5
SurveyMonkey is the default choice for teams that want survey creation and analysis in one tool without a long implementation cycle. Its analysis features include automatic sentiment detection for open-ended responses, word clouds, response filtering, cross-tabulation, and trend tracking over time.
The AI-powered SurveyMonkey Genius scores your survey design before you send it, which improves data quality at the source. For mid-market teams, the strength is speed: you can go from survey design to analyzed results in the same session. Industry benchmarks let you compare NPS or CSAT against peers. The trade-off is depth, SurveyMonkey's text analysis is more basic than purpose-built AI tools. If deep open-text analysis is the primary need, you'll likely outgrow it.

Key Features
- AI Sentiment Analysis: Automatically detects sentiment in open-ended survey responses.
- Industry Benchmarks: Compare NPS, CSAT, and engagement scores against industry averages.
- Cross-Tabulation and Filtering: Slice results by demographic, response type, or custom variables.
- Survey Design AI (Genius): Scores and suggests improvements to your survey before sending.
SurveyMonkey Pros
- Fastest path from survey creation to analyzed results
- Massive template library and broad integration ecosystem
SurveyMonkey Cons
- Text analysis is basic compared to dedicated AI platforms
- Advanced features like cross-tabs and benchmarks locked behind higher-tier plans
SurveyMonkey Pricing
From $30/user/month (Team Advantage, billed annually). Enterprise plans with custom pricing available.
7. Qualtrics: Best for Enterprise Survey Programs with Advanced Analytics
G2 Rating: 4.4/5
Qualtrics earns its enterprise reputation for a reason. Text iQ handles open-ended survey analysis with theme detection and sentiment scoring. Stats iQ provides statistical testing, regression analysis, and correlation modeling for teams that need research-grade rigor from their survey data. Together, they cover both qualitative and quantitative analysis in one platform.
That depth comes at a cost. Qualtrics rewards organizations that can commit dedicated admins to setup, taxonomy management, and ongoing system ownership. For lean CX teams that need to see value in weeks, the implementation timeline can feel heavy. For enterprise research programs and multi-department deployments, it remains the most complete analytics suite available.

Key Features
- Text iQ: AI-powered open-text analysis with theme detection, sentiment scoring, and topic clustering.
- Stats iQ: Built-in statistical analysis: regression, ANOVA, correlation, and significance testing without coding.
- Role-Based Access and Governance: Control who creates surveys, who sees results, and how data flows across departments.
- Advanced Survey Logic: Branching, piping, randomization, and embedded data for complex research designs.
Qualtrics Pros
- Most complete enterprise survey analytics suite available
- Text iQ and Stats iQ cover both qualitative and quantitative analysis in one platform
Qualtrics Cons
- Enterprise pricing ($50K+/year) puts it out of reach for most mid-market teams
- Implementation timelines can stretch to months for complex deployments
Qualtrics Pricing
Custom enterprise pricing. Contact sales for a quote.
Statistical and BI Survey Analysis Tools
Purpose-built for deeper analysis: cross-tabulation, significance testing, regression, and advanced visualization from survey data.
8. Displayr: Best for Statistical Survey Data Analysis and Automated Reporting
G2 Rating: 4.3/5
Displayr fills the gap between Excel and SPSS. If your team needs cross-tabulation with statistical significance testing, automated banner tables, and regression analysis from survey data, but doesn't want to manage desktop statistical software, Displayr handles it in a browser-based tool.
Reproducibility is its standout feature. Analyses save as live documents that refresh when new survey data arrives, so quarterly reports don't need rebuilding from scratch. It imports data from Qualtrics, SurveyMonkey, SPSS, CSV, and API sources. Basic AI text analysis for open-ended responses is included, though less sophisticated than dedicated NLP platforms. For market research firms that live in cross-tabs and significance tests, Displayr replaces the export-to-SPSS-to-PowerPoint workflow.

Key Features
- Automated Cross-Tabulation: Generate banner tables with significance testing built in.
- Statistical Analysis: Regression, ANOVA, factor analysis, and clustering without coding.
- Live Reporting Documents: Analyses update automatically when new survey data arrives.
- Data Import Flexibility: Connects with Qualtrics, SurveyMonkey, SPSS, CSV, and API sources.
Displayr Pros
- Replaces the SPSS-to-PowerPoint workflow with a single browser-based tool
- Live documents mean quarterly survey reports don't require rebuilding
Displayr Cons
- Learning curve for teams without a statistical analysis background
- AI text analysis is basic compared to dedicated NLP platforms
Displayr Pricing
Annual plans available. Contact for pricing.
9. Tableau: Best for BI-Driven Survey Data Visualization
G2 Rating: 4.4/5
Tableau isn't a survey tool. It's a BI platform that's excellent for survey data visualization when your analysis needs go beyond what survey platforms offer. The value: you can place survey results alongside CRM data, support metrics, revenue figures, and product usage in a single interactive dashboard. That cross-source view is something no dedicated survey tool can match.
Setup requires you to export or connect survey data first, build the visualizations yourself, and maintain the data pipeline. There's no AI text analysis built in. For teams with analysts who already know Tableau, adding survey data to existing dashboards is practical. For teams without BI expertise, a dedicated survey analysis platform will deliver faster time-to-insight.

Key Features
- Multi-Source Data Blending: Combine survey results with CRM, support, revenue, and product data in one view.
- Drag-and-Drop Visualization: Build interactive charts, maps, and dashboards from survey data without coding.
- Tableau Prep: Clean and reshape survey data before visualization.
- Publishing and Sharing: Publish interactive dashboards to Tableau Server or Tableau Cloud for team access.
Tableau Pros
- Most flexible visualization platform for combining survey data with operational metrics
- Massive community, templates, and learning resources
Tableau Cons
- No built-in survey creation or AI text analysis for open-ended responses
- Requires data pipeline setup and analyst expertise to get value
Tableau Pricing
From $75/user/month (Tableau Creator). Viewer and Explorer tiers available.
Conversational and Flexible Survey Platforms
These tools prioritize survey design and response quality, with built-in analysis ranging from basic dashboards to moderate AI-powered insights.
10. Typeform: Best for Conversational Survey Design with Built-In Analysis
G2 Rating: 4.5/5
Typeform's core strength is survey design, not analysis. Its one-question-at-a-time format consistently achieves higher completion rates than traditional grid-style surveys, which means better data quality before analysis even starts. Built-in analysis includes response summaries, filtering, basic sentiment detection, and integrations with Google Sheets, Slack, and Zapier.
For teams whose primary survey problem is low response rates rather than analysis depth, Typeform solves the upstream issue. If your surveys are hitting 15% completion rates and you need to fix that first, Typeform's conversational approach is worth the trade-off. It won't replace Thematic or Displayr for deep text analysis or statistical modeling.

Key Features
- Conversational Survey Format: One question at a time, with conditional logic and answer piping.
- AI Survey Generation: Generate survey drafts from plain-language descriptions.
- Response Summaries and Filtering: Basic analysis dashboards with response visualization and basic sentiment detection.
- Integration Ecosystem: Connects with Google Sheets, Slack, Zapier, HubSpot, and Salesforce.
Typeform Pros
- Consistently higher completion rates than traditional survey formats
- Wide integration ecosystem for pushing data to dedicated analysis tools
Typeform Cons
- Analysis capabilities are basic: no AI theme detection or statistical testing
- Not built for NPS, CSAT, or CES metrics out of the box
Typeform Pricing
From $25/month. Plus, Business, and Enterprise tiers available.
11. Pollfish: Best for Market Research Surveys with Built-In Audience Access
G2 Rating: 4.3/5
Pollfish fills a gap most survey analysis tools don't address: audience access. If you don't have an existing customer list to survey, Pollfish provides access to global respondent panels across 160+ countries. You define demographics, targeting criteria, and questions, and Pollfish delivers responses in real time.
Built-in dashboards show response distributions, cross-tabs, and sentiment from open-ended questions as responses arrive. An AI-powered survey builder generates questions from plain-language prompts, which speeds up study creation for teams running frequent research. For concept testing, brand perception, and competitive benchmarking, the combination of audience panels and analysis in one tool is practical. For CX teams analyzing existing customer feedback, Pollfish is less relevant, you already have the audience.

Key Features
- Global Respondent Panels: Access millions of respondents across 160+ countries with demographic targeting.
- AI Survey Builder: Generate survey questions from plain-language prompts.
- Real-Time Analysis Dashboard: Response distributions, cross-tabs, and open-ended sentiment as responses arrive.
- Advanced Targeting: Filter respondents by demographics, behavior, location, and custom screening questions.
Pollfish Pros
- Built-in audience panels solve the "who do I survey?" problem for market research
- Real-time responses: most surveys complete within hours of launch
Pollfish Cons
- Per-response pricing adds up at scale for ongoing survey programs
- Analysis capabilities are moderate: no advanced AI text analysis
Pollfish Pricing
Pay-per-response from ~$0.95/complete. Managed research plans available.
12. Alchemer: Best for Flexible Survey Programs with Workflow Automation
G2 Rating: 4.4/5
Alchemer sits in the mid-market sweet spot: more flexible than SurveyMonkey, less complex than Qualtrics. It offers advanced survey logic (branching, piping, scoring, quotas), cross-tabulation reporting, and workflow automation that triggers actions based on survey responses. Multi-channel distribution supports web, email, SMS, and embedded surveys.
For analysis, it includes real-time dashboards, response filtering, cross-tabs, and data export to BI tools. It doesn't have AI-powered text analysis for open-ended responses, there's no automated theme detection. But for teams that need strong survey design combined with structured quantitative analysis at mid-market pricing, Alchemer provides a practical middle ground.
Key Features
- Advanced Survey Logic: Branching, piping, scoring, and quota management.
- Cross-Tabulation Reporting: Compare response patterns across demographics and custom segments.
- Workflow Automation: Trigger emails, tasks, or CRM updates from survey responses.
- Multi-Channel Distribution: Web, email, SMS, and embedded survey delivery.
Alchemer Pros
- More flexible survey logic than SurveyMonkey at a lower cost than Qualtrics
- Workflow automation connects survey responses directly to business actions
Alchemer Cons
- No AI-powered text analysis for open-ended responses
- UI feels dated compared to newer platforms in this category
Alchemer Pricing
From $55/user/month. Professional and Platform tiers available.
What Mistakes Should You Avoid When Choosing Survey Analysis Software?
Five patterns that consistently lead to wasted budget or stalled programs.
Treating survey creation and analysis as the same problem. (Teams also frequently conflate thematic analysis with sentiment analysis. See our thematic analysis vs sentiment analysis guide for when to use each.)
Tools like Google Forms and Typeform are effective for collecting responses. The bigger risk is over-investing in manual feedback analysis before realising the volume won't scale. Their analysis stops at charts and filters. If you have thousands of open-ended responses, you need a dedicated analysis layer, or a platform that combines both. For a detailed look at where teams go wrong, see our guide to common mistakes in analysing qualitative feedback.
Prioritizing analysis depth over insight routing.
The most sophisticated NLP engine is useless if findings never reach the person who can act on them. Prioritize platforms that connect analysis to action, alerts, tasks, and CRM updates, not just dashboards.
Ignoring open-ended responses because they're harder to analyze.
Quantitative survey data (ratings, NPS scores, multiple choice) is easy to chart. The harder, more valuable signal sits in the verbatims. If your tool can't handle text analysis at scale, you're leaving the richest part of your survey data unanalyzed.
Overpaying for enterprise when you need mid-market.
Qualtrics is powerful, but its pricing and implementation complexity are designed for 500+ person organizations. Platforms like Alchemer or Zonka Feedback deliver strong analysis at a fraction of the cost.
Buying before mapping integration requirements.
The best analysis engine is useless if it can't connect to your CRM, helpdesk, or BI stack. Map your data sources before evaluating AI depth.
Which Survey Analysis Software Is Right for Your Team?
The right platform depends on where your current analysis process breaks down.
If your team can't keep up with open-text responses, AI-powered tools like Zonka Feedback, Thematic, or Chattermill remove that bottleneck. If you need statistical rigor, Displayr or Tableau give you the analytical depth that standard survey platforms lack. If response rates are the problem upstream, Typeform or Pollfish fix data quality at the source.
For teams building end-to-end CX programs, collecting and then acting on satisfaction data, it's worth pairing your analysis platform with the right tools to measure and improve customer satisfaction across every touchpoint.
The teams that get the most value from survey analysis treat it as a continuous intelligence system: connecting findings to business metrics, routing insights to the people who can act on them, and tracking whether those actions moved the numbers.


.svg)


