


.svg)
 Healthcare
 Finance
 Retail
 SaaS & Digital
 eCommerce
 Education

 Salesforce
  HubSpot
 Pipedrive
 Mailchimp
 Zendesk
  Freshdesk
 HelpScout
  Front
Front Slack
Slack  Zoom
Zoom Google Sheets
  Zapier
  Integrately
 Webhooks
  Blogs
Blogs Webinar
 Product Updates


Are you struggling to make sense of your survey response data? Learn how to analyze your survey results and leverage Customer Feedback data to make effective business decisions.
Customer Feedback is an essential element for every business that helps them to serve the customers in the best possible way and foster Customer Satisfaction. Customer Feedback Surveys are the best way to collect feedback from your customers. But merely sharing survey forms is not enough.
To truly understand what your customers feel about the experience they get and what they expect from your business, it is necessary to ask the right survey questions and analyze their responses to obtain accurate insights and know what exactly customers want from you. Therefore, effective survey Reporting and Analysis is essential to utilize Customer Feedback to make the right business decisions and improvements that are in line with the feedback.
Elevate CX with Customer Feedback🔥
Collect in-moment feedback at all touchpoints in the customer journey and leverage feedback insights to transform the customer experience.

In this article, we will explore how you can analyze the survey reports effectively to leverage Customer Feedback for making the right business decisions that lead to the growth of your business.
Let’s start with defining Survey Analysis!
Table of Contents
- What is Survey Analysis?
- Types of Survey Data
- How to Analyze Survey Data?
- Analyzing Feedback Responses with Zonka Feedback
What is Survey Analysis?
Survey Analysis is the process of examining and interpreting the feedback data collected in the form of responses to your feedback survey. It involves organizing and summarizing survey responses, analyzing the data, and presenting it in the form of meaningful reports.
Survey Data Analysis helps you to understand the attitude, behavior, and reaction to certain business decisions, choices and preferences of the customers and thus helps make data-driven decisions to improve your products and services and thus grow your business.
Let’s learn about the types of survey data.
Types of Survey Data
Survey Response Data is mainly of two types, viz., Quantitative Survey Data and Qualitative Survey Data. Let’s learn about both of them.
1. Quantitative Survey Data
Quantitative Survey Data is information that is expressed in numerical form. This data is generated by the survey responses to the closed-ended questions, i.e., the questions in which response options are already given to the respondents, and they can only choose from those particular options to respond.
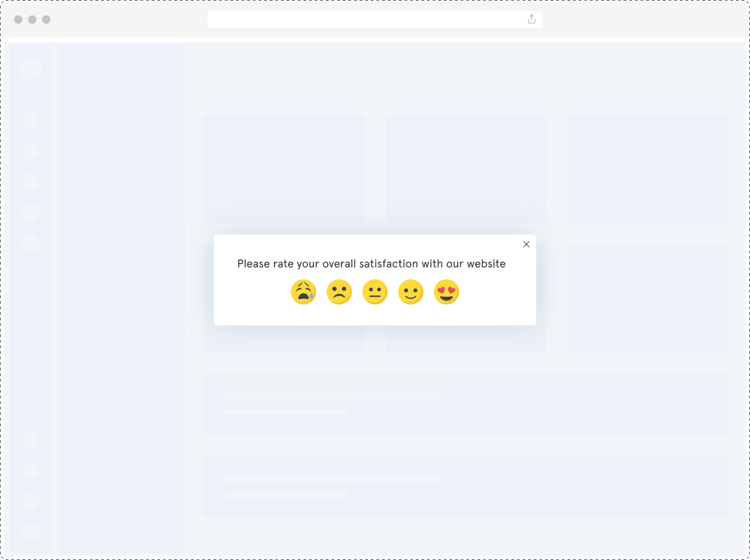
Examples of Quantitative survey response data can be NPS surveys or CSAT surveys, ratings, and scores, the number of customers that got to know about your business from a particular source like social media or TV advertisement, etc.
2. Qualitative Survey Data
Qualitative data refers to the survey response data that is not numeric and does not contain any specific values. It is more likely to be descriptive or subjective in nature and can be expressed in any form, like written sentences, audio, video, images, or any visual or verbal data. Qualitative data can not be easily counted or calculated as quantitative data. Qualitative data is generated through the survey responses to the open-ended questions asked in a survey.
Examples of qualitative survey response data are a complaint shared by a customer, a special experience described in the customer’s own words, a video shared to explain a particular situation, an audio message, a recording with a customer support executive, or a screenshot of a bug shared by a product user, etc.
While quantitative data is useful in understanding the level of Customer Satisfaction through the ratings shared by the customers, quantitative data helps to understand what caused them to rate the way they rated their customer experience.
Let’s learn how to analyze the survey results effectively.
How to Analyze Survey Data?
- Establish Clear Survey Objectives
- Select the Right Survey Questions
- View and Overview of Survey Data
- Use Filters to get insights into the responses and scores
- Analyze Agent Performance
- Compare Feedback from Different Locations
- Consider Survey Trends
- Use Text Analysis for Open-ended Questions
Let’s learn how you can follow these steps to do an analysis of your survey response data in an effective manner.
1. Establish Clear Survey Objectives
When you want to analyze and leverage the survey response data to grow your business, the process starts with creating the survey itself, for which you should be having a clear objective in mind. Ask these questions to yourself.
- What do you want to achieve through this survey?
- Do you want to know the level of Customer Satisfaction?
- Do you want to measure Customer Loyalty?
- Do you want to track Agent Performance?
- Do you want to achieve more sales?
Answer these questions to yourself and set clear survey objectives in mind. This will help you create effective surveys with which you can achieve these goals.
2. Select the Right Survey Questions
When you have clear survey objectives in mind, the time is to select customer feedback questions to be asked in your survey. Select the right survey questions and methodology based on the goals you think your survey responses will help you to achieve.
For instance, if you want to measure Customer Loyalty, use NPS Survey Question for this purpose. If you want to measure the level of customer satisfaction with respect to various aspects of your business, it is best to include CSAT survey questions asking customers to rate those aspects. If you want to measure Agent Performance, a CES Survey methodology will suit your requirements.
Your survey responses depend on the methodology you use and the questions you ask in your customer surveys. With the right questions, you will get accurate responses which will be beneficial to do an effective analysis of the survey data and fetch you meaningful information for your business.
Prefer using customer satisfaction metrics like NPS, CSAT, and CES to obtain quantitative data, which is better and easy to analyze. These methodologies can fetch you valuable quantitative feedback with which you can create powerful reports to help you make the right decisions for your business.
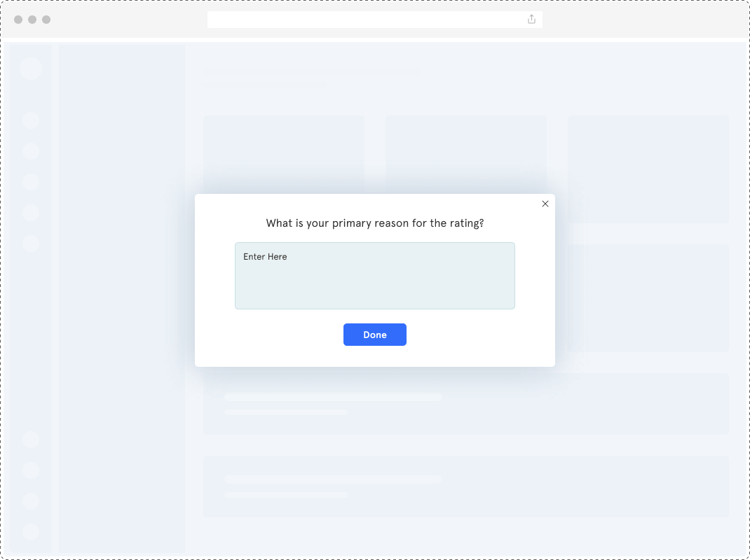
Consider using a combination of open-ended and closed-ended questions. On the one hand, closed-ended questions will fetch you quantitative data to analyze, and open-ended follow-up questions will help you know the reasons behind the customers’ ratings, which will again help you make the right strategies and decisions for your business.
3. View an Overview of Survey Data
When you have received the survey responses, view a summary of the survey response data. Use a good Survey Software that helps you view the summary and analysis of your survey responses.
Zonka Feedback enables you to create and view a Snapshot Report for this purpose. With a Snapshot report of the survey responses, you can view various things like:
- Customers’ response time
- Survey completion time
- Survey channels through which they responded
This helps you analyze how easy and time-consuming it was for the customers to respond to your survey and which survey channel works best for you to get maximum responses.
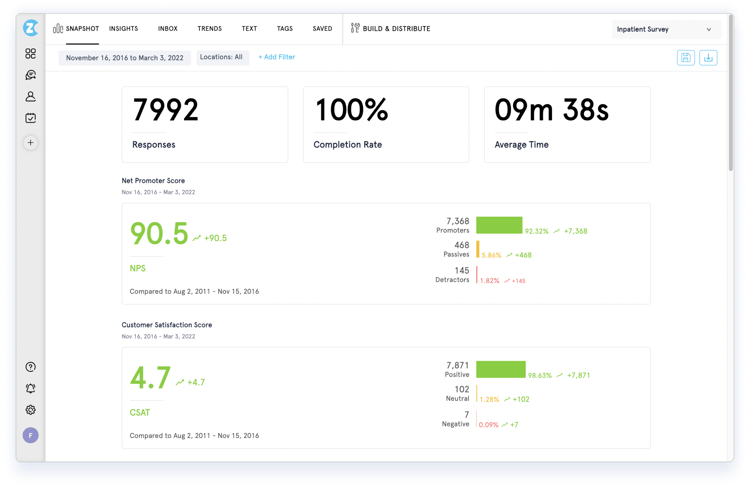
Analysis of metric survey responses and scores of the metrics that you used in your survey, like Net Promoter Score (NPS), Customer Satisfaction (CSAT) Score, and Customer Effort Score (CES).
4. Use Filters to get Insights of the Responses and Scores
When you get all the survey response data together, apply filters on the data to get the reports of the customer insights as per your requirements. For instance, if you want to review the responses of the customers who responded the same day as the survey was sent to them, you can apply a filter to your response inbox on the date.
Similarly, as per your objectives of analyzing the data, you can apply filters on Locations, Teams, Contact Attributes, Survey Response choices, CX Metrics, and more to view responses based on the conditions you set.
5. Analyze Agent Performance
If you want to know how your service agents and different teams are performing to serve the customers, use Team Performance Reports for this purpose. As per your survey objective, you must have shared a CES survey or a survey with another methodology to know how your agents are performing.
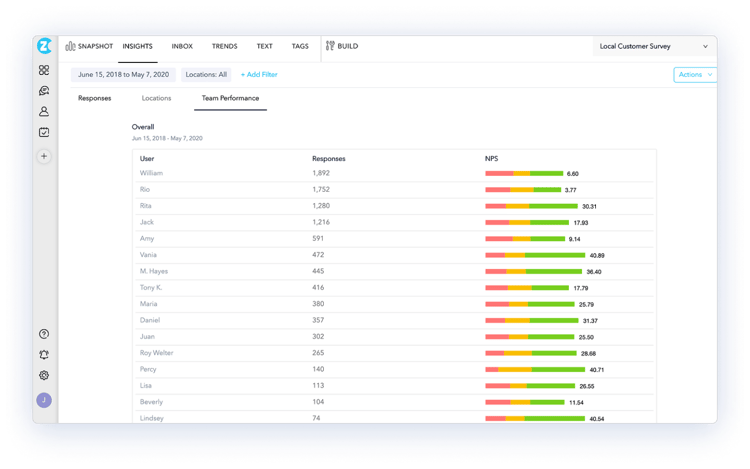
With a Team Performance Report, you can view team-wise survey response reports and compare team performance based on the metric survey ratings and scores like NPS, CSAT, and CES. You can also get heatmaps and leaderboards for your particular agents and teams.
6. Compare Feedback from Different Locations
When you have multiple branches at various locations, analyze how each branch is performing with the help of the Location Insights Report. With this report, you can view location-wise responses of the customers at every location and compare these responses to understand how each location is performing and what are the choices and preferences of the customers at different locations.
Location Insights Report helps you get a detailed, question-wise comparison for all your locations so that you can analyze and compare the customers’ choices and agent performance at different locations.
7. Consider Survey Trends
Looking at Survey Response Trends is very important to analyze in order to know whether your business is able to improve Customer Experience over time. Survey Trends Report can help you serve this purpose.
.png?width=750&height=488&name=Trends%20Report%20-%20Healthcare%20(1).png)
When you conduct regular Relationship Surveys like monthly, quarterly, and annual surveys, you should view the Trends Report to compare your NPS or CSAT score with the previous ones. This will help you ensure a continuous improvement in your products and services to retain your existing customers and attract new customers into your business.
8. Use Text Analysis for Open-ended Questions
There are many reports for analyzing quantitative data, but what about the qualitative data generated with the responses to open-ended questions? Text Analysis Report is the one that can help regarding this! It provides you with Word Cloud and Word Count table for this purpose.
- A word cloud is a visual representation of the most commonly used words in the survey responses like Excellent, Good, Friendly, Amazing, Poor, Bad, Thanks, etc. The word cloud represents words in different sizes and colors depending on their usage by the customers to give you an idea of how most of your customers perceive your products and services.
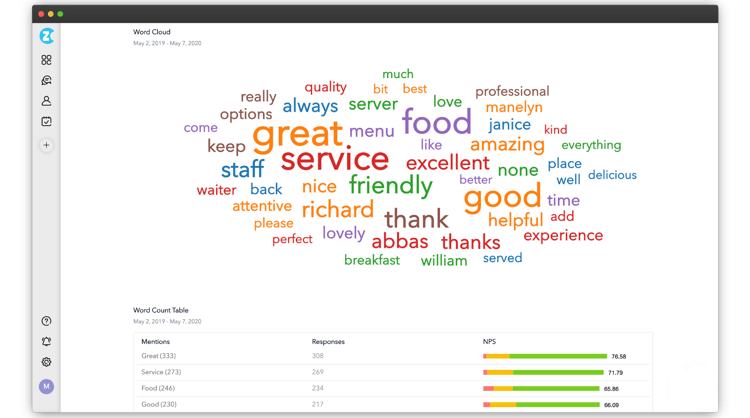
- Word Count Table picks words used in the survey responses in the open-ended responses and tells you how many times those words were used or how many customers used those words, functioning effectively as a word counter. For instance, it will tell you that the word ‘Excellent’ was used by 10 out of 15 customers for the responses to a particular question, or the word ‘Helpful’ was used by how many customers to answer another specific question.
Let’s explore how Zonka Feedback helps you to analyze your feedback survey responses.
Analyzing Feedback Responses with Zonka Feedback
Zonka Feedback, being a powerful Customer Feedback and Experience Management Software, not only helps you create and share surveys and collect feedback, but it also offers you robust analytical and reporting features. With Zonka Feedback, you can easily apply filters to get the desired reports, save and export them. You can also schedule regular reports like Weekly reports, monthly reports, or annual reports.
Along with the survey reports discussed above, you can also fetch these reports as per your business requirements.
Real-time reports - You can choose to get real-time reports as soon as your customers share a survey response. This will help you take instant action on feedback (wherever required) to resolve issues, improve Customer Experience and prevent churn.
CX metric reports - With CX metrics reports, you can view a detailed analysis of Customer Satisfaction, loyalty, and perceived efforts to get a work done with you in the form of NPS, CSAT, and CES reports.
Drill-down reports - You can apply filters and get instant access to rapid information in real time and see the reasons behind the customers’ ratings. This will help you make the right business decisions, changes, and strategies to grow your business.
Graphical Survey Report - With Graphical Survey Report, you can see the changing patterns and trends of feedback and CX metrics to track your business growth and identify the trends prevailing. These reports show visually appealing graphical representations of large datasets.
Zonka Feedback is one of the most powerful survey tools to collect Customer Feedback and analyze survey results through its amazing analytical features and filtering options. The various kinds of reports it offers help you to have a clear picture of what your customers think and expect from your products, services, and company.
Schedule a demo and see how it helps you to do a powerful analysis of survey response data to leverage Customer Feedback and make effective business decisions.


