.svg)
 Healthcare
 Finance
 Retail
 SaaS & Digital
 eCommerce
 Education

 Salesforce
  HubSpot
 Pipedrive
 Mailchimp
 Zendesk
  Freshdesk
 HelpScout
  Front
Front Slack
Slack  Zoom
Zoom Google Sheets
  Zapier
  Integrately
 Webhooks
  Blogs
Blogs Webinar
 Product Updates


TL;DR
- Voice of customer analytics turns scattered feedback into a single, queryable view of what customers want, how they feel, and what they're reacting to, across surveys, support tickets, reviews, and social channels.
- Modern VoC analytics runs three lenses at the same time: thematic analysis (what topics customers raise), experience signals (sentiment and intent per topic), and entity recognition (who and what specifically).
- The right platform handles both structured and unstructured feedback, tags sentiment at the theme level rather than only overall, and routes feedback to the team that should act on it.
- This guide covers how VoC analytics works under the hood, the 4 channels feedback comes from, real use cases by industry, and how to evaluate a VoC analytics platform before buying.
Most tools stop at collecting feedback. Voice of customer analytics is where that feedback becomes decisions. It isn't sentiment analysis. It isn't survey reporting. And it isn't whatever your CRM's feedback dashboard shows you.
What VoC analytics actually does is run three things at once on every piece of feedback you collect: it identifies the topics customers are raising, the experience signals embedded in their language, and the specific people, products, or places they're talking about. Zonka Feedback runs all three, thematic analysis, sentiment scoring, and impact analysis, on every response as it lands. Get all three right and the analysis stops being a quarterly report and starts driving customer experience, product, and customer retention decisions in real time.
This guide covers how that works under the hood, where the data comes from, what it looks like in real customer programs, and what to evaluate before buying a platform.
VoC Analytics vs Software vs Platform vs Tools: What's the Difference?
These four terms get used interchangeably. They aren't the same thing.
| Term | What it Means | When to Use it |
| VoC Analytics | The process of analyzing customer feedback to extract insight | When discussing methodology |
| VoC Software | The product category that performs the analysis | When evaluating vendors |
| VoC Platform | A unified system covering collection, analysis, and action | When discussing enterprise tooling |
| VoC Tools | Specific point solutions for individual VoC tasks | When comparing features |
If you're shopping for a vendor, our breakdown of the best VoC platforms in 2026 is the better starting point for comparing customer analytics tools side by side. This guide stays focused on the analytics piece: how the analysis actually works, what it produces, and how to know if a platform does it well.
What Is Voice of Customer Analytics?
Voice of customer analytics is the analytical layer of a voice of customer program. It's the process that turns raw customer feedback into customer insights a team can act on. It uses natural language processing and machine learning to identify themes, sentiment, customer intent, and named entities across surveys, support tickets, online reviews, and social media comments. You'll also see it called VoC analysis or voice of customer analysis, the same discipline under different names.
The broader VoC discipline (sometimes spelled voice of the customer, depending on the source) is about listening: collecting customer feedback wherever your customers are talking. VoC analytics is the layer on top that makes that feedback usable.
It helps to separate this from the wider AI-in-VoC conversation. Analytics is the set of analysis methods described on this page, while AI applied across the entire feedback lifecycle (collection, routing, and follow-up) is a broader shift. This guide stays on the analysis methods.
It's also not the same as sentiment analysis, even though competing blogs use the two terms loosely. Sentiment is one of three lenses inside VoC analytics. The other two (themes and entities) matter as much, and most teams underuse them.
What VoC Analytics Actually Covers
- Theme detection from open-text responses using natural language processing (what topics customers are raising, and how those topics relate to each other)
- Sentiment scoring per theme, not per response. A comment that praises one feature and complains about another gets correctly split, so customer pain points and customer complaints get tagged separately from positive feedback
- Customer intent classification: is this person making a feature request, escalating a complaint, asking a question, or telling their friends about you?
- Entity recognition: pulling out specific people, products, locations, and (for serious platforms) custom entities specific to your industry
- Data visualization and routing to the right team, with alerts when something needs immediate attention
What VoC Analytics Is NOT
- Not sentiment analysis alone. Sentiment on its own tells you customers are unhappy. VoC analytics tells you they're unhappy about checkout on mobile, that it's getting worse week over week, and that the complaints are concentrated in your enterprise segment.
- Not survey reporting. Survey reporting works on structured data like scores and multiple choice. VoC analytics works on unstructured qualitative data too. Support tickets. Online reviews. Chat logs. Customer service calls. The kind of feedback that never had a survey question attached to it.
- Not plain text analytics. Text analytics is the broader NLP category. VoC analytics is text analytics pointed specifically at customer feedback and tied to customer outcomes, which is also what separates it from generic survey analysis.
- Not a manual tagging exercise. Five years ago, analyzing 5,000 open-text responses by hand took someone two weeks. Modern VoC analytics uses machine learning to analyze feedback in real time.
That covers what it is. The bigger question for 2026: why it matters now more than ever.
Why Voice of Customer Analytics Matters Now (2026)
Across 100+ CX leaders Zonka interviewed in 2025, 87% still manually analyze open-text feedback. Most of them know they shouldn't. Headcount stayed flat. Customer expectations rose. Feedback volume didn't slow down either.
Here's the math. Five years ago, a mid-sized CX team got maybe 500 open-text responses a month, mostly surveys and the occasional review. Today, the same team is sitting on survey verbatims plus a Zendesk queue plus G2 reviews plus Intercom chats plus Slack threads from sales. Gartner estimates that 80-90% of all new enterprise data is unstructured, and most of it sits unanalyzed. The feedback isn't the problem. The bottleneck is what to do with all of it, and that is the job a voice of customer program's analytics layer exists to solve.
Four reasons it matters now:
- You can identify trends before they hit your online reviews. When checkout breaks on mobile, you don't want to find out from a one-star G2 review. You want to know when the third support ticket mentions it. The same logic applies to NPS dips, CSAT drops, and rising customer frustration patterns.
- Feedback routes to the right team automatically. A feature request doesn't need to land in a support queue. A customer complaint doesn't need to wait three days for a product manager. Modern VoC analytics tags intent and routes accordingly.
- Customer churn signals show up in language patterns first. "Considering alternatives," "if this happens again," "we're evaluating other options." These phrases appear in feedback weeks before the actual non-renewal.
- You stop guessing and start citing evidence. When the product team asks "which 5 features matter most?", you can answer with theme frequency, sentiment, and which accounts the requests came from. The shift is from anecdotal customer behavior observations to data-backed prioritization.
The Business Impact of VoC Analytics
Analytics earns its keep when it changes a number the business already cares about. Done well, VoC analysis connects customer needs to outcomes: fewer repeat complaints, faster issue detection, and a roadmap ordered by evidence instead of opinion.
The mechanism behind that is impact analysis, ranking themes by business impact rather than by raw frequency, so the loudest topic isn't automatically treated as the most important one. A theme raised by 40 at-risk enterprise accounts outranks one raised by 400 free users, even though the raw count says otherwise.
This is also where data analysis stops being a reporting chore and becomes a forecasting tool. Track which themes move overall customer satisfaction and you can see the score bending before the quarter closes, not after. For the specific numbers to watch alongside your themes, see our guide to voice of customer metrics.
How Voice of Customer Analytics Actually Works: The Three Pillars
Most explainers of VoC analytics describe a linear process: collect, then analyze, then act. That's how the workflow looks from outside. Under the hood, the analysis runs three things at the same time on every single response.
We call them the three pillars: thematic analysis (what), experience signals (how and why), and entity recognition (who and what specifically). Skip any one of them and you're getting a quarter of the picture.
Pillar 1: Thematic Analysis (What Are Customers Talking About?)
Thematic analysis is the layer that auto-discovers topics from open-text responses and organizes them into a hierarchy that evolves as new feedback arrives. It's the foundation of every downstream piece of customer analysis: identify trends, surface customer pain points, and group recurring themes so the rest of the analytics layer has something concrete to score and route.
Here's how it works. From Zonka's analysis of 1M+ feedback responses across industries and 8 languages, the average response over 100 characters contains 4.2 distinct topics. A simple tagger gives that response one label. Real thematic analysis breaks it apart.
A customer comment like "the checkout button is broken on mobile, but the new dashboard looks great" gets parsed as:
- Theme: Checkout, Sub-theme: Mobile, Tag: Bug
- Theme: Dashboard, Sub-theme: UI, Tag: Positive feedback
Two themes. Two opposite signals. From one sentence.
Before AI, this was someone's job. An analyst would read each response, pick a tag from a spreadsheet, and hope they remembered the taxonomy from three weeks ago. The output: 40+ hours a quarter analyzing customer feedback by hand, inconsistent categories, stale by the time the report shipped. After AI, the taxonomy auto-evolves. When 50 customers mention a new feature, a new sub-theme surfaces. You don't define the categories upfront. The customer data does.
The practical effect: you go from "we have a lot of feedback about the dashboard" to "of 340 dashboard mentions this month, 240 are about loading speed and 80 are about filtering. Loading speed is up 30% week over week." This is the layer that powers everything downstream.
For a deeper look at the tool category that runs this layer, see our breakdown of the best text analysis tools for customer feedback.
Pillar 2: Experience Signals (How Do They Feel, and Why Are They Reaching Out?)
Experience signals answer two questions, not one. Most blogs collapse them into "sentiment" and miss half the picture.
Question 1: Experience Quality (how was the experience?)
This is the layer most people think of as customer sentiment, but it's broader. It captures customer frustration, customer concerns, and negative feedback at a granular level. It covers:
- Sentiment: positive, negative, mixed, neutral
- Effort: high-friction language ("took forever," "had to call three times")
- Urgency: time-sensitive situations ("need this resolved today")
- Churn signals: risk of leaving ("considering alternatives")
- Emotion: frustration, delight, confusion in language patterns
The key detail: all of this runs at the theme level, not only the response level. Take that same checkout-and-dashboard sentence again. It should produce:
- Theme: Dashboard, sentiment: positive
- Theme: Checkout, sentiment: negative, effort: medium, urgency: low
A simple model averages these into "neutral" and you lose both signals. 29% of responses in Zonka's research had mixed sentiments. That's a third of your data getting flattened if you analyze at response level only. Zonka's sentiment analysis handles this at the theme level by default.
Question 2: Customer Intent (why are they reaching out?)
This is the underused half. About 23% of responses contain a clear intent signal, and that signal dictates which team should own the response.
| Intent | What it sounds like | Routes to |
| Advocacy | "I've told all my friends about you" | Marketing |
| Feature Request | "I wish you had…" | Product |
| Question | "How do I…?" | Support / Knowledge Base |
| Complaint | "This is unacceptable" | Support / Operations |
| Escalation | "I want to speak to a manager" | Management |
Intent detection is what turns VoC analytics from a reporting layer into a routing layer. The feature request from a $200K account doesn't sit in a support inbox for three days. The escalation language triggers an alert before the customer has called twice.
If you want to compare platforms specifically on this capability, look at the best sentiment analysis tools for customer feedback.
Pillar 3: Entity Recognition (Who or What Specifically?)
Entity recognition pulls out the specific names from the text. This is where industry-specific platforms separate from generic ones.
Standard entities cover staff names, product names, locations, and competitors. Useful, but every NLP model handles those.
The differentiator is custom entities. 32% of responses in Zonka's analysis mentioned at least one entity. When those entities map to the operational structure of your business, the analysis stops being descriptive and starts being actionable. Zonka's ability to track aspects and entities is what ties each comment to the part of the business that owns it.
| Industry | Standard entities | Custom entities |
| Airline | Staff, location | Flight number, route, cabin class |
| Retail | Staff, store, product | Product category, brand name, SKU |
| SaaS | Product, competitor | Feature name, plan tier, integration |
| Healthcare | Staff, location | Department, treatment type, doctor name |
| Hospitality | Staff, location | Room type, amenity, booking channel |
Without custom entities, a hotel review that says "the spa was great but our Junior Suite faced the parking lot" gets tagged "amenities." With them, you get: spa (positive), and Junior Suite (negative, specifically the view). The operational fix is obvious. The first tag tells you nothing actionable, even with good data visualization tools layered on top.
This is the pillar most teams under-invest in. Worth fixing.
Where VoC Analytics Data Comes From: 4 Feedback Channels
Every piece of VoC data your customers produce falls into one of four customer touchpoints. Most VoC programs cover one or two well and ignore the rest, which means they only see part of the entire customer journey. The signal density actually increases as you move right.
| Channel | Sources | Data Type | Why it Matters |
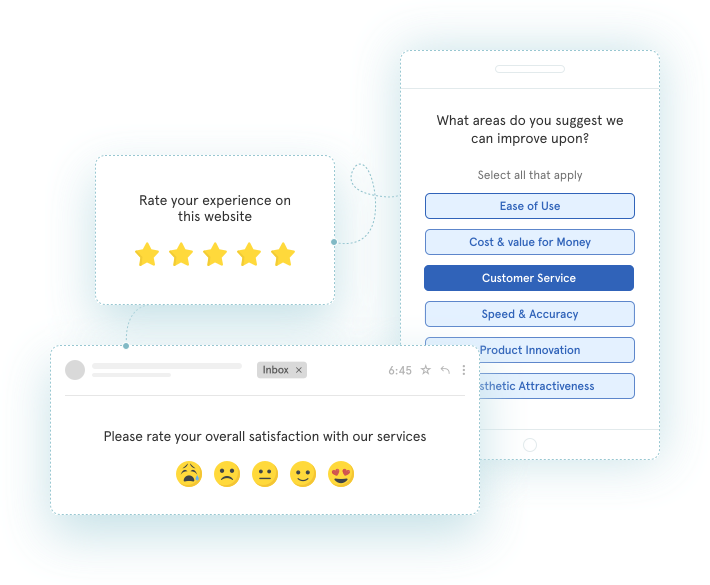
| Direct | Net Promoter Score (NPS), CSAT, Customer Effort Score (CES) surveys, feedback forms, in-app widgets, focus groups | Scores + open-text | Highest intent. The customer chose to respond |
| Support | Zendesk, Intercom, Freshdesk, ticket systems, live chat, contact centers, customer service interactions | Mostly unstructured | Reveals friction before it shows up in surveys |
| Public | Online reviews (Google, G2, App Store, Trustpilot), social media comments | Fully unstructured | What prospects see, and it influences acquisition |
| Product | Jira tickets, sales call transcripts, feature requests, Slack threads | Scattered across tools | Often holds the strongest signals, usually ignored |
The further right on this spectrum, the more unstructured the feedback data, and the more intelligence hiding in it. The Three Pillars framework applies to all four channels, but most teams have only set it up on Direct. If you're still choosing a platform for those core metrics, our guide to NPS tools is a good place to start.
One category sits outside these four: behavioral or passive signals. The drop-offs, rage clicks, and repeat visits that show friction without a word being typed. They don't replace stated VoC feedback, but they tell you where to point the analysis first.
If you're not running surveys yet, our piece on voice of customer surveys covers the Direct channel. The fastest way to start is our free voice of customer survey template with 39 questions across 8 dimensions.
VoC Analytics in Action: 4 Use Cases
What this looks like in practice, across four real situations.
Use Case 1: SmartBuyGlasses (NPS +30% Across 15 Country Stores)
SmartBuyGlasses runs NPS across 15 country-specific stores. The initial setup gave them scores by country, but mixed NPS across regions didn't tell them what to fix. The thematic analysis layer surfaced sizing complaints as the dominant negative theme, concentrated in three countries.
The fix was specific: a size-recommendation widget at point of purchase. NPS climbed 30% across the affected stores within two quarters. The score improvement was the outcome. The actionable signal (sizing concentrated in three specific markets) was what made the fix possible.
Use Case 2: B2B SaaS (Prioritizing the Feature Request Backlog)
A 200-person B2B SaaS company collects roughly 3,000 monthly feedback responses across in-app surveys, Zendesk tickets, and customer service calls. The product team's question: which feature requests come up most often, and which come from at-risk vs healthy accounts? It's a customer success and customer churn question disguised as a roadmap question, and the answer depends on cross-referencing feature requests against customer demographics like plan tier, account size, and tenure.
Customer Intent detection auto-tags feature requests vs complaints. Entity recognition pulls out the specific feature names. The CSM data layers in account health. The output: the team can see exactly which features get requested most often by at-risk accounts vs healthy ones. That's the backlog priority order, decided by analyzing data on customer preferences instead of by whoever shouts loudest in the planning meeting.
Use Case 3: Regional Hospital Network (Custom Entities for Service-Line Tracking)
A regional hospital network runs CSAT and HCAHPS surveys across 12 facilities. Measuring customer satisfaction at the overall facility level hid which specific department, doctor, or treatment type was driving each score.
Custom entity recognition pulls department names, doctor names, and treatment types from the open-text comments. Each entity ties to sentiment plus urgency signals. The voice of customer dashboard now shows that negative sentiment is concentrated in one of 12 emergency departments. The leadership team now has somewhere specific to intervene.
Use Case 4: Insurance (Claims-Journey Analysis)
For an insurance carrier, the claims journey is the experience. FNOL (first notice of loss), claim resolution, and renewal each produce different feedback. The same customer can leave a glowing review of their adjuster and a furious complaint about the time it took to process. Without per-theme sentiment, those average out.
Running the three-pillar analysis on the claims pipeline surfaced where in the journey the friction sits. Most carriers assume it's resolution. The data showed it was the post-FNOL silence: three to five days where the customer hears nothing. The fix was a status update cadence, not a process redesign.
For deeper sector-specific coverage, see VoC tools for insurance.
What to Look For in a VoC Analytics Platform
You don't need a 50-criteria scorecard for comparing customer analytics tools. You need to ask the right seven questions. The capabilities that separate a real VoC analytics platform from a survey reporting tool with sentiment bolted on, and the key performance indicators each one feeds:
| Capability | Why it Matters | What to ask Vendors |
| Per-theme sentiment (theme-level, not overall averages) | Mixed-emotion comments get correctly tagged instead of averaged into neutral | "Does sentiment work at sentence/theme level, or only at response level?" |
| Customer intent detection | Routes feedback to the right team automatically | "Can it detect feature requests vs complaints vs escalations vs questions?" |
| Custom entity recognition by industry | Tracks specifics like flight numbers, store locations, drug names, rather than generic categories | "Can I train custom entities for my industry?" |
| Real-time alerts on sentiment shifts | Catches issues before they become public reviews | "How fast does an alert fire after a negative response lands?" |
| Role-based dashboards | Each team sees what's relevant to them | "Can I configure separate views for Product, Support, and CX?" |
| Multi-channel coverage (Direct + Support + Public + Product) | Otherwise you're analyzing 25% of the picture | "Which integrations come pre-built? Which need custom work?" |
| Closed-loop workflow | Insight without action is only a report. Closed loops drive improved customer satisfaction | "Can the tool assign tickets to teams based on detected intent?" |
Once you know which of these matter most for your team, our roundup of voice of customer tools covers how the leading platforms stack up against this checklist.
How to Run a Voice of Customer Analytics Program in 5 Steps
The methodology behind the platform. Whether you collect feedback from one channel or ten, the framework is consistent. Every implementation looks slightly different. For a wider look at voice of customer methodology approaches, the methodologies guide goes broader.
Step 1: Define What Success Looks Like
Pick the business outcome. Customer retention? NPS or other customer satisfaction scores? Support ticket volume? Whatever it is, write it down before you set up the analytics. Then map themes back to that outcome. What themes would you expect to see in the data when retention is improving? When it's worsening?
Most programs skip this step. They set up dashboards, get dashboards, and a year later can't explain whether the dashboards helped.
Step 2: Connect Your Feedback Channels
Map the four channels (Direct, Support, Public, Product) to your existing data collection setup and customer touchpoints. Be honest about the gaps in feedback collection: most teams are 60-70% covered on Direct, under 30% on Public and Product. Gather data from two or three channels where signal density is highest first. Don't try to connect all four in week one.
Step 3: Set Up Theme and Signal Detection
Configure thematic analysis with your existing taxonomy, or let the platform auto-discover it. Enable per-theme sentiment and customer intent detection. Add the custom entities specific to your industry. This is the part where the difference between a survey tool and a real VoC analytics platform shows up. If the platform can't do custom entities for your industry, you've picked the wrong platform.
Step 4: Route Insights to the Right Teams
Map intent types to team owners. Feature Request to Product. Complaint to Support. Escalation to Management. Configure the role-based dashboards. Set up real-time alerts for high-urgency or churn-risk signals.
A common mistake: routing everything to one team and calling it "VoC ownership." That guarantees the insights don't move.
Step 5: Close the Loop and Measure Impact
Track which themes drove which actions, and what changed afterward. Communicate VoC-driven changes back to customers. You asked for X, here's what we did. This is the loyalty-building step: customers see you're addressing customer concerns from real feedback. Review weekly: which themes are growing, which are shrinking, which are new?
This step is where most VoC programs fail. Not because the analytics is wrong. Because nobody owns acting on the output. Closed loops are how unhappy customers become satisfied customers, and how satisfied customers become loyal customers. For the failure patterns to watch for, see why most Voice of Customer programs fail. It's the contrast piece to this guide.
Conclusion
VoC analytics works when three pillars run together. Themes tell you what, experience signals tell you how and why, and entities tell you who and what specifically. Most teams get one or two right and assume the third doesn't matter. It does. When all three run across all four feedback channels (direct, support, public, product), VoC analytics stops being a survey reporting layer and starts driving customer retention, product, and customer experience decisions. The teams that get it right build a competitive advantage that compounds with every loop closed.
Zonka Feedback runs the full three-pillar framework out of the box to help teams enhance customer experience without rebuilding their feedback stack. See how Zonka's AI feedback analytics works.


.png)

_%20Benefits%2c%20Use%20Cases%2c%20Examples%20%26%20More.svg)