


.svg)
 Healthcare
 Finance
 Retail
 SaaS & Digital
 eCommerce
 Education

 Salesforce
  HubSpot
 Pipedrive
 Mailchimp
 Zendesk
  Freshdesk
 HelpScout
  Front
Front Slack
Slack  Zoom
Zoom Google Sheets
  Zapier
  Integrately
 Webhooks
  Blogs
Blogs Webinar
 Product Updates


TL;DR
- Website surveys are short questionnaires embedded directly in web pages to collect real-time feedback from visitors; they tell you why visitors behave the way analytics shows they do, not just that they bounced.
- Six widget types serve different purposes: popups are proactive and interruptive; feedback buttons are passive and always-on. Most sites benefit from running both.
- The three settings that determine whether a survey works: targeting (who sees it), trigger timing (when it fires), and display frequency (how often). Most teams configure one and ignore the other two.
- Keep website surveys to 1–3 questions. Completion rates drop sharply after five, and on mobile two is the practical ceiling.
- This guide covers widget types, question banks by use case, targeting configuration, and a step-by-step walkthrough for getting a survey live with Zonka Feedback.
Your team just relaunched the pricing page. New layout, cleaner copy, faster load time. You did everything right. A week in, conversions are down 12%.
Analytics tells you people are leaving. It doesn’t tell you why. It can’t. You can see the drop-off point, but not what the visitor was thinking when they bounced. Whether they were confused by the plan structure, skeptical about pricing, or just comparison-shopping their way through three other tabs.
That’s the gap website surveys fill. Not as a replacement for analytics, but as the layer that explains it. A single well-placed question — triggered at the right moment, on the right page — can tell you in two days what A/B testing takes two months to figure out.
This guide covers how to build one that gets real answers: widget types, question design, targeting configuration, and the install. Step by step.
What Is a Website Survey?
A website survey is a short questionnaire embedded directly in a web page to collect real-time feedback from visitors while they’re browsing. It lives on public-facing pages: landing pages, pricing pages, blog posts, checkout flows. It captures feedback from whoever’s there.
It’s not an email survey sent after the fact. Not an in-app widget inside your product dashboard. The audience is the anonymous or logged-in visitor, engaging with the page right now.
Responses can be quantitative (a 1–5 rating, an NPS score, a yes/no), qualitative (open text), or both. Most effective website surveys use a mix.
Six Types of Website Surveys
Not all website surveys look the same, and the format you choose matters as much as the question you ask.
| Widget Type | Best Trigger | Best Use case | Intrusiveness |
| Popup | Exit intent, time delay, scroll depth | Exit surveys, post-purchase NPS, drop-off diagnosis | High |
| Slide-up | Time delay, scroll depth | Passive research, CES after completing a task | Medium |
| Feedback Button | Always-on (visitor-initiated) | Bug reports, passive feedback, always-available door | Low |
| Popover | User click on linked element | Contextual feedback, feature reactions | Low |
| Bottom Bar | Page load | Persistent one-question asks | Low–Medium |
| Embedded | In-content placement | Blog feedback, article helpfulness rating | None |
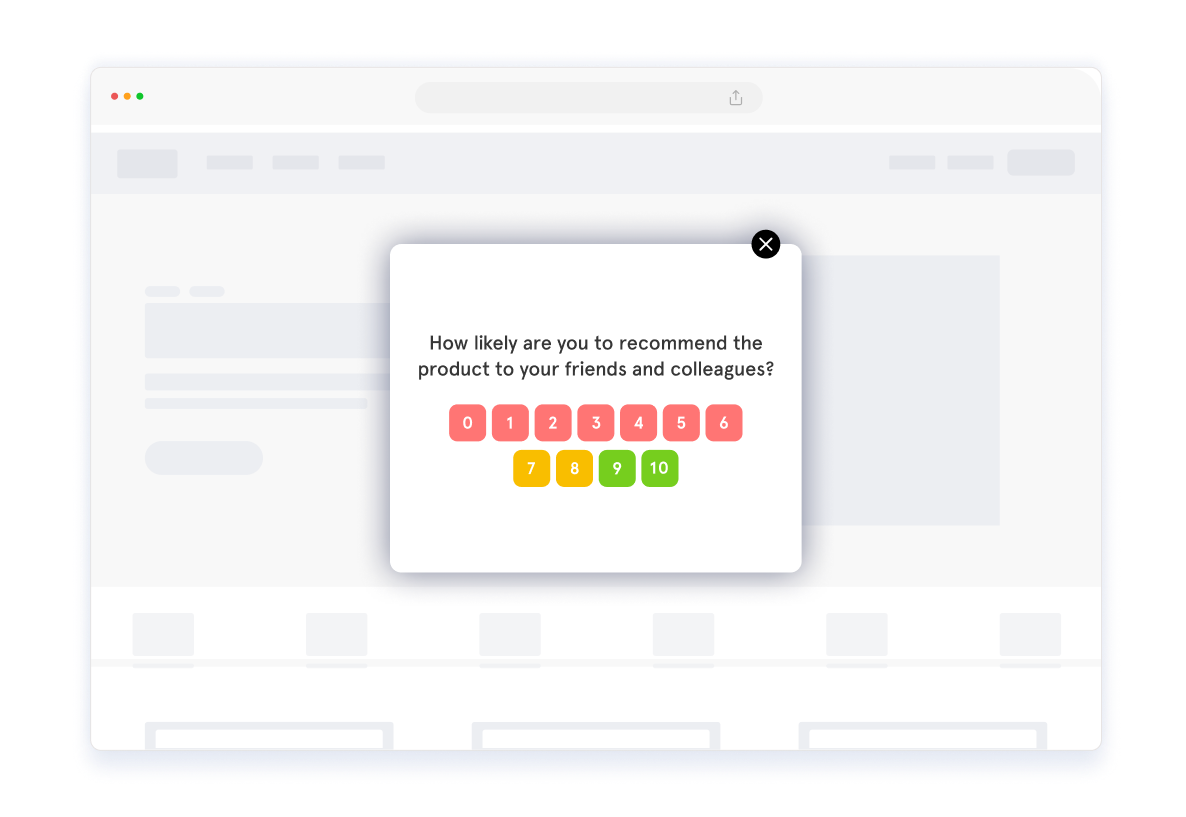
The default choice for most teams is the popup. That’s often the wrong call.
Popup surveys are proactive — you’re initiating the ask, and the visitor didn’t ask to be asked. That works when the timing is right (exit intent, post-purchase) and the question earns the interruption. But if you’re running a general “how’s your experience?” question that fires on every page for every visitor, you’ll burn through impressions fast and collect noise.
A feedback widget is quieter. It sits on the edge of the page, always visible, and the visitor chooses when to engage. You’ll get fewer responses. But the people who click it have something to say. For bug reporting, feature requests, and general qualitative feedback, passive widgets tend to outperform triggered popups.
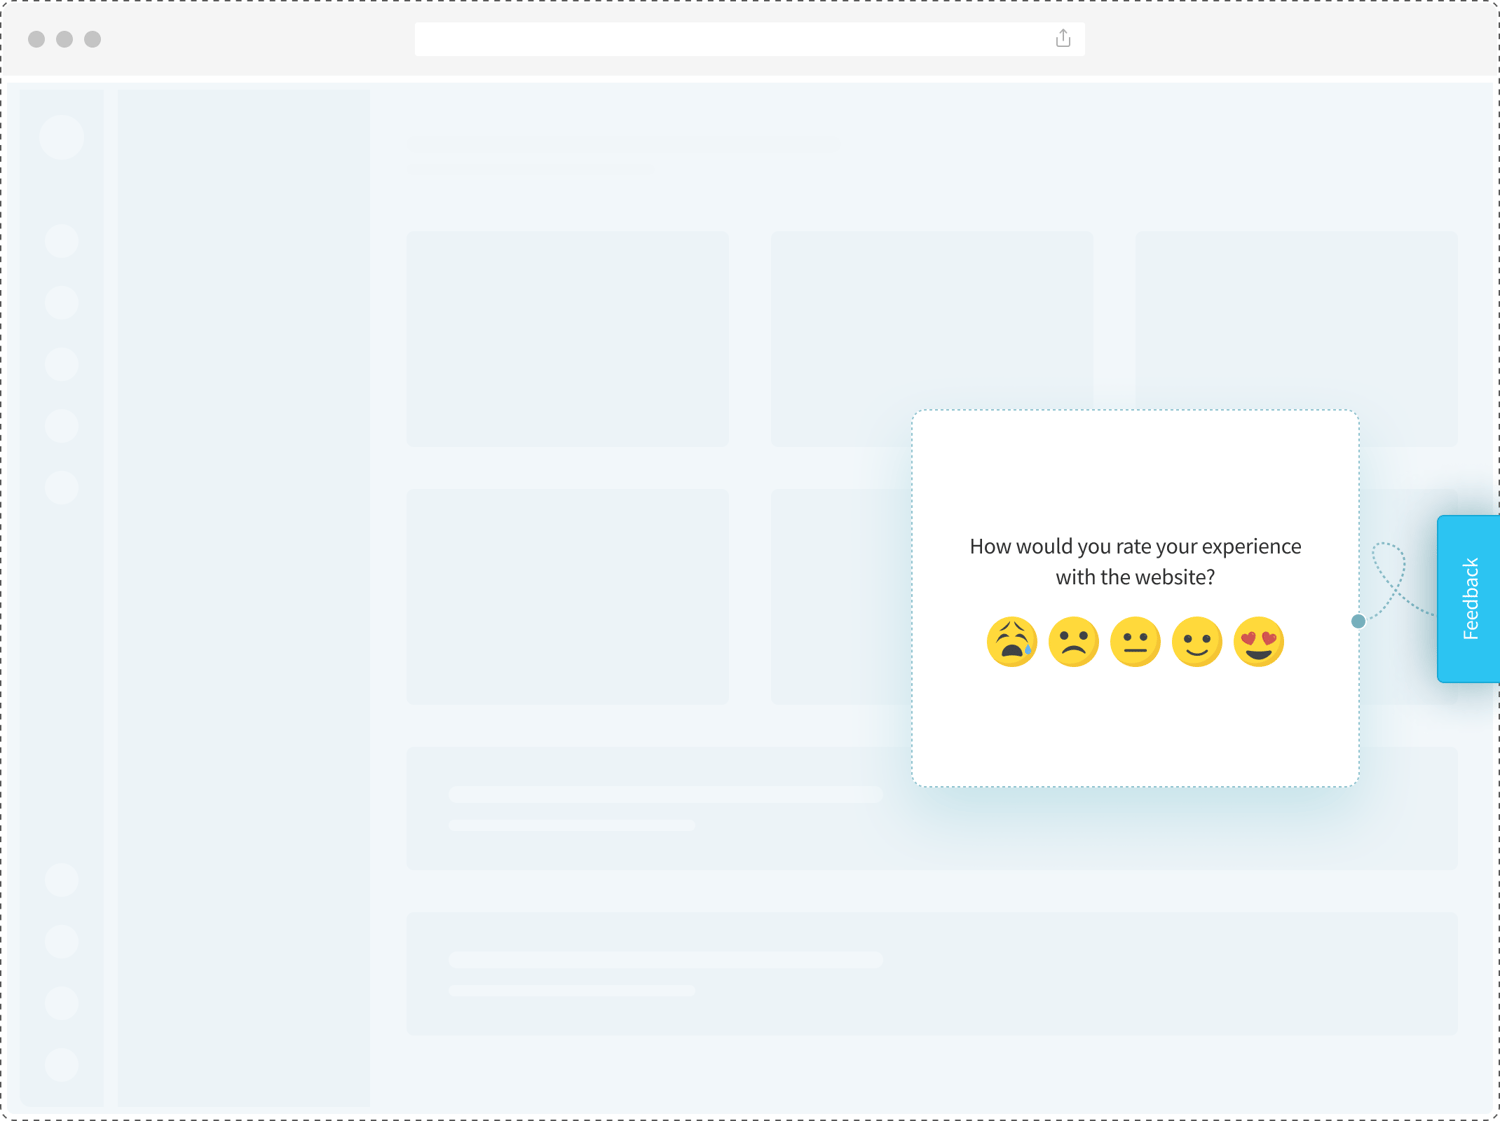
Most sites benefit from running both: one widget for proactive, timed research programs, one as the permanent passive channel.
How to Create a Website Survey in Six Steps
Step 1: Define What You’re Trying to Learn
Before you open a survey builder, answer one question: what decision will this survey inform?
Not “gather feedback.” Not “understand our users.” A specific decision — whether to redesign the checkout, whether the new feature FAQ is working, whether pricing-page visitors are confused by the plan structure. That decision tells you which survey type to run, how many questions you need, and when to trigger it.
Teams that skip this step end up with surveys that produce data nobody acts on.
To match metric to goal: NPS for loyalty and likelihood to recommend, CSAT for satisfaction with a specific interaction, CES for effort after completing a task. If you’re still orienting on which format fits which situation, what are website surveys covers the broader landscape — types, use cases, and when each makes sense.
Step 2: Choose Your Widget Type
Two questions determine this.
First: do you want to initiate the conversation, or let the visitor initiate it? Proactive: popup, slide-up, bottom bar. Passive: feedback button, popover.
Second: how heavy is the ask? A 10-question usability research survey doesn’t belong in a popup. A one-question “Did you find what you were looking for?” is perfectly fine there. The heavier the ask, the lower the intrusiveness should be.
Match the container to the content.
Step 3: Write Your Survey Questions
Three questions max. Most visitors won’t reach question four.
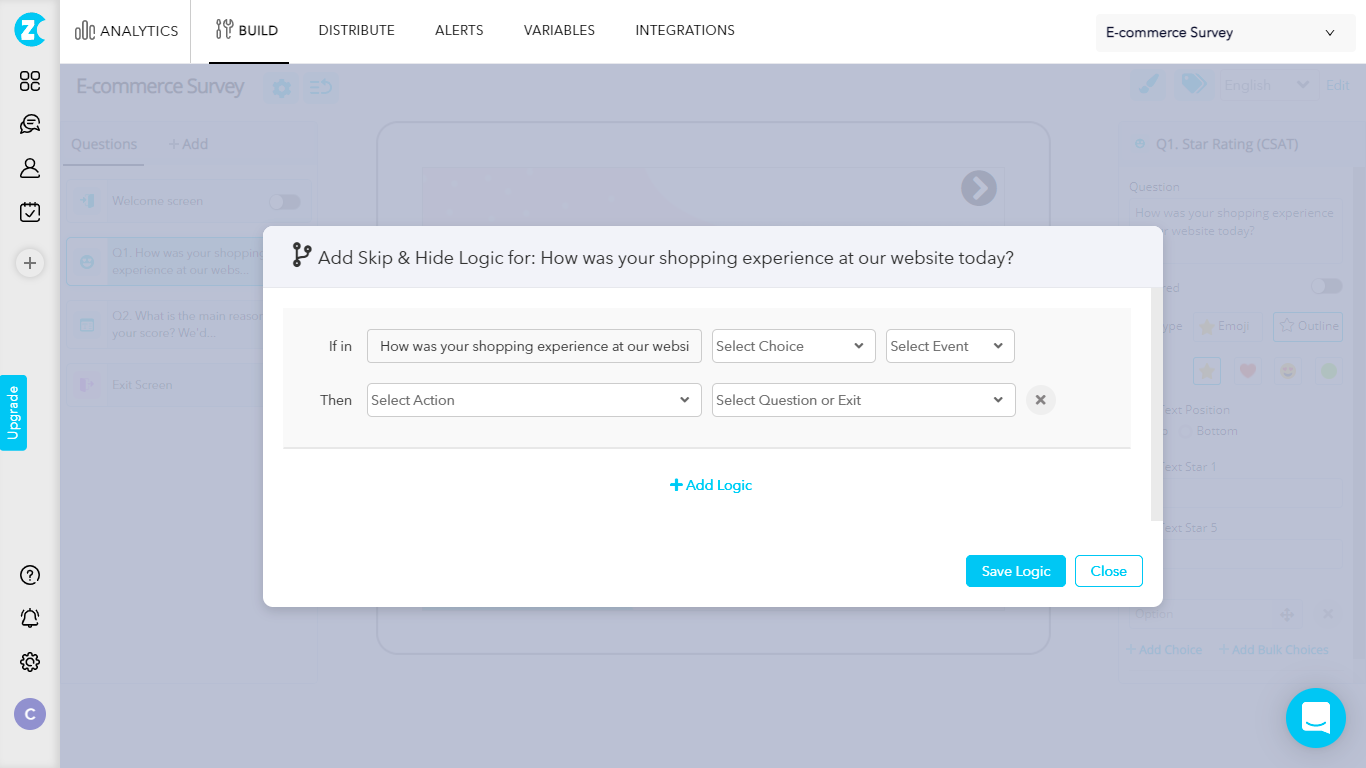
Lead with your most important question. If someone abandons halfway through, you still want the core data point from those partial responses. Use skip logic for follow-ups: if a visitor rates 3/5 or lower, show “What went wrong?” — if they rate 8 or above, show “What worked best?” That way you’re not asking everyone both.
Watch for bias in how you phrase things. “What was confusing about this page?” presupposes something was confusing; you’ll get confirmation of that assumption, not real signal. “How would you describe your experience finding what you needed?” is neutral enough to capture both positive and negative responses.
Small word choice. Big difference in what you get back.
Step 4: Configure Targeting, Triggers, and Frequency
This is where most implementations go wrong. Three settings. Most teams configure one and ignore the other two.
Targeting controls who sees the survey. Show it on a specific page (the pricing page only, not the homepage), on specific devices (desktop only, because the mobile layout doesn’t fit a multi-question popup), or to a specific user segment (returning visitors, users who’ve spent more than 60 seconds on the page). You don’t need to survey every visitor; even 20% of a busy page will collect enough responses in days.
Triggers control when the survey appears. Page load fires immediately, which is almost always too early: the visitor hasn’t seen anything yet. Time delay (5–10 seconds) gives them a moment to orient. Scroll depth (50% of page) ensures they’ve engaged with the content before you ask about it. Exit intent fires when the mouse moves toward closing the tab, which makes it the right moment for an exit-intent survey — the visit is already ending from the visitor’s perspective.
Display frequency is the setting most teams ignore and then regret. “Show every visit” trains visitors to close the survey on reflex. Set it to “show once” or “show until submitted” for almost every use case. For NPS, once per 90 days per user is the standard.
One underused setting: the percentage targeting slider. You don’t need 100% of visitors to see your survey. At 20% on a page with 500 daily visitors, you’re still reaching 100 people a day. That’s plenty for pattern detection inside a week.
Step 5: Install and Go Live
Zonka Feedback uses a workspace-level JS snippet. One workspace, one code: every survey you create in that workspace runs off the same snippet once it’s installed.
Copy it from Settings → Developers → JS Client Code, and paste it before the closing </head> tag in your site’s HTML. If you’re on a no-code setup or use Google Tag Manager, add it as a Custom HTML tag in GTM. No developer needed for either route.
Test before you announce anything. Append #zf_debug=true to your page URL and reload. A debug overlay confirms whether the code is running and communicating with Zonka’s servers. Do this in an incognito window. Zonka’s client stores session data in local storage, and previous test sessions can mask display issues you’d otherwise catch here.
Step 6: Monitor Results and Iterate
Give it a week before making changes. Not a day.
Watch three things in the first week: response volume (is the widget showing up and collecting?), completion rate (are visitors finishing the survey or dropping mid-way?), and the distribution of responses (are you getting a healthy spread, or is everything clustering at the extremes?).
At 50–100 responses, you have enough to spot patterns. That’s the right threshold. Waiting for 500 responses to validate your first iteration means a poorly configured survey runs far longer than it should.
Website Survey Questions by Use Case
Generic questions produce generic feedback. These are the questions that tell you what to fix.
Exit Intent
What stopped this visit from converting?
- “What’s the main reason you’re leaving today?” (multiple choice with 4–5 options: pricing, looking for more information, found what I needed, other)
- “Did you find what you were looking for?” (Yes / No / Partially, followed by “What were you looking for?” if No or Partially)
- “Is there anything preventing you from completing your purchase or signing up today?” (open text)
The open-text follow-up is almost always worth including for exit intent. Those responses are unfiltered, and the most likely to surface the thing your team hasn’t thought to ask about.
Post-Purchase
Measure satisfaction at the moment of highest engagement.
- “How satisfied are you with your purchase experience today?” (CSAT 1–5 scale)
- “Was there anything that almost stopped you from completing your order?” (open text)
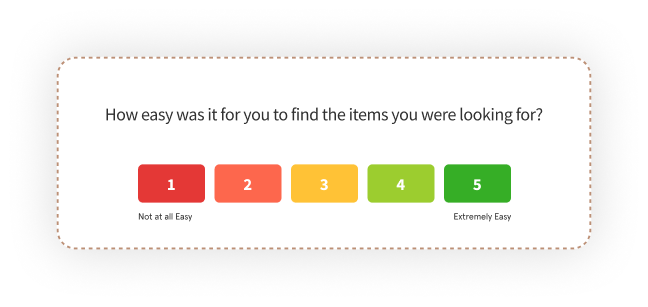
- “How easy was the checkout process?” (CES 1–7 scale)
Run these on the order confirmation or thank-you page. That’s the one moment where the visitor is still in purchase mode. You won’t get this window again.
Navigation and Usability
Diagnose where visitors are losing their way.
- “Did you find what you were looking for today?” (Yes / No)
- “How would you describe your experience navigating this site?” (open text)
- “How easy was it to find what you needed?” (CES 1–7)
The yes/no question works as a screener. If the answer is No, the open-text response tells you what was missing. When you’re getting a lot of “No” without clear patterns in the follow-ups, the navigation structure is usually the issue, not the content.
Content Feedback
For blogs, knowledge base articles, help docs.
- “Was this article helpful?” (Yes / Somewhat / No)
- “What would make this page more useful to you?” (open text)
Short. Fast. Genuinely useful for prioritizing which content to update.
NPS: Loyalty Baseline
Two questions. Always two.
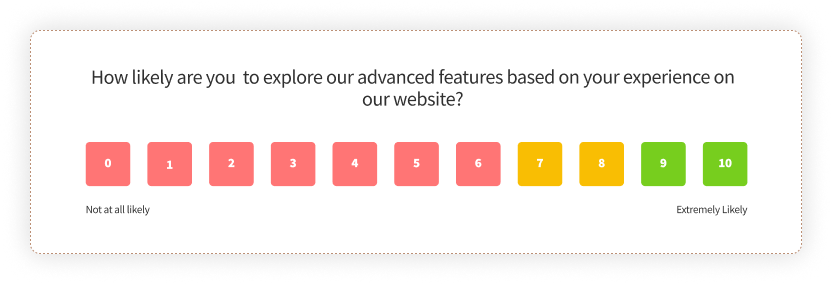
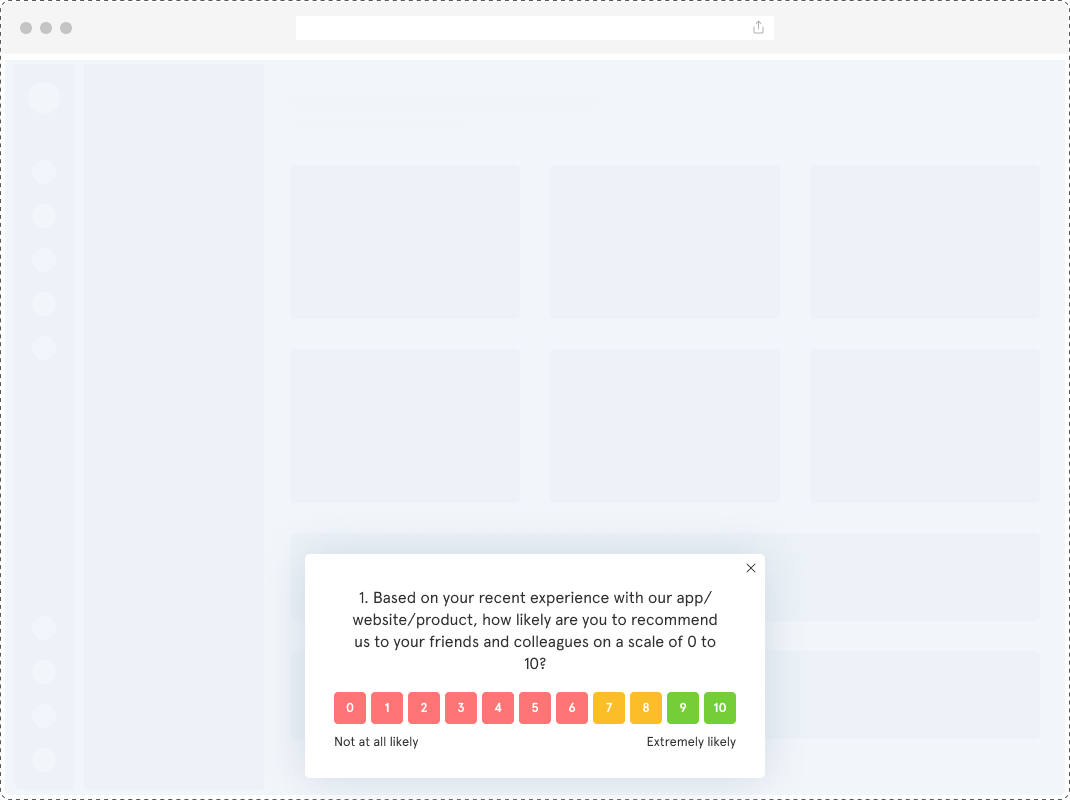
- “How likely are you to recommend [company] to a friend or colleague?” (0–10 scale)
- “What’s the main reason for your score?” (open text)
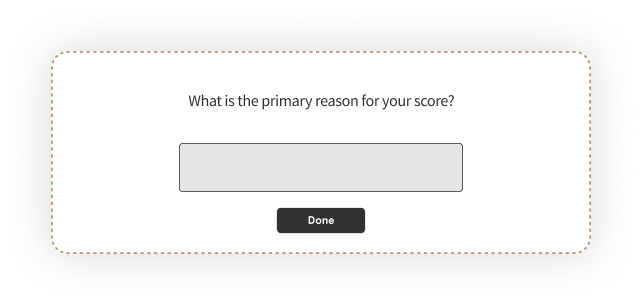
NPS earns the second question because the score alone tells you almost nothing actionable. A 7 from a customer who says “your product is good but onboarding is confusing” tells the CS team exactly what to fix. A 7 with no follow-up is just a number on a dashboard.
How Long Should a Website Survey Be?
One to three questions. That’s the range where completion rates hold.
SurveyMonkey’s research on survey length shows completion rates drop sharply after five questions — and for website surveys specifically, the drop-off starts earlier, because visitors aren’t in “survey mode” the way email respondents sometimes are. They’re browsing. They have somewhere else to go.
On mobile, two questions is the practical ceiling. Survey popups that aren’t mobile-optimized lose completions immediately, and the layout issues are easy to miss if you only test on desktop.
The practical rule: start with one core question. Add an open-ended follow-up only if you need richer context to act on the rating. A standalone “How easy was it to find what you needed today?” gives you a CES trend line. Pairing it with “What made it difficult?” gives you the why. You don’t always need both, especially early on, when you’re still figuring out whether the survey is working at all.
The one exception is NPS. It’s designed as two questions, and the open-ended follow-up isn’t optional. Everything else: keep it short.
Website Survey Best Practices
For a deeper tactical guide, website survey best practices covers frequency, sequencing, and platform-specific setup in more detail. The principles worth internalizing before your first launch:
- Target one page, not the whole site. A survey on your pricing page tells you about pricing-page friction. A survey on every page tells you nothing in particular.
- Set a frequency cap. Show once per session minimum. For NPS, once per 30 days per user. Visitors who see the same survey twice in a week start closing it on reflex. And that trains a habit you can’t undo.
- Match widget to ask weight. A three-question research survey needs a lower-intrusiveness container: slide-up or feedback button. Not a popup that interrupts the experience before the visitor has formed an opinion.
- Consistent branding. Unbranded surveys get fewer completions. Add your logo and brand colors. Visitors are more likely to respond when it looks like it’s from you.
- Don’t lead with demographic questions. If you need to ask someone’s role or company size, put it last. Opening with “What’s your job title?” before asking about their experience reads like registration, not research.
- Test in incognito before going live. Cached session data from previous tests can make the survey behave differently from how a first-time visitor will see it. Incognito removes that variable every time.
- Review after 50 responses, not 500. Patterns emerge early. Waiting for a bigger sample before iterating means a poorly designed survey runs longer than it needs to.
How to Create a Website Survey With Zonka Feedback
Once the code is installed, you won’t need to touch it again. Every new survey you create in the same workspace goes live automatically.
Step 1: Create your survey. Log in, click “Add Survey,” and choose from a pre-built template, a blank canvas, or the AI builder if you want a starting point based on your goal.
-png.png?width=2022&height=1258&name=frame_generic_light%20(71)-png.png)
Step 2: Choose your channel. In the distribution settings, select “Website & Web Apps.” Then pick your widget type: popup, slide-up, feedback button, popover, bottom bar, or embedded. Pick the one that matches your use case.
-png.png?width=2022&height=1258&name=frame_generic_light%20(68)-png.png)
Step 3: Customize. Add or remove questions, adjust fonts and colors to match your brand, add your logo, and configure multi-language settings if you’re running surveys across regions.
-png.png?width=2022&height=1258&name=frame_generic_light%20(69)-png.png)
Step 4: Configure the three panels.
- Appearance: size, button color, position (left or right), auto-close behavior
- Targeting: which pages (specific URLs or all), which devices, which user segments
- Behavior: trigger type (page load, time delay, scroll depth, exit intent), display frequency
Don’t rush this panel. This is where the implementation either works or wastes your time.
-png.png?width=2022&height=1258&name=frame_generic_light%20(70)-png.png)
Step 5: Install and test. Copy the JS snippet from your workspace settings. Paste it before the closing </head> tag, or add it via Google Tag Manager. Test with #zf_debug=true in an incognito window.
-png.png?width=2022&height=1258&name=frame_generic_light%20(67)-png.png)
Want to start with a ready-built structure? Here’s a live website feedback survey template you can use immediately:
To see how targeting and response analysis work in practice, you can create a website survey with Zonka and walk through the full configuration yourself.
Where Most Survey Programs Stall
Building the survey is the easy part. It takes a day to configure and an hour to refine.
What takes longer is building the habit of acting on what it surfaces. Before you write your first question, decide what you’ll do with the answer. If 40% of your exit-intent responses cite pricing, does someone on your team have the authority to act on that? If your NPS follow-ups are full of “support is slow,” who reads them?
Start with one question. Run it for two weeks. Read every open-text response.
That’s it. That’s the whole method.
Ready to configure your first survey? Schedule a walkthrough and we’ll show you how targeting and analysis work for your specific setup.


.svg)


.svg)


