

.svg)
 Healthcare
 Finance
 Retail
 SaaS & Digital
 eCommerce
 Education
 Salesforce
  HubSpot
 Pipedrive
 Mailchimp
 Klaviyo
 Zendesk
  Intercom
 Freshdesk
 HelpScout
  Front
Front Jira
Jira Slack
Slack  MS Teams
 Zoom
Zoom Google Sheets
  Zapier
  Integrately
 Make
Make  Webhooks




 MS Teams



TL;DR
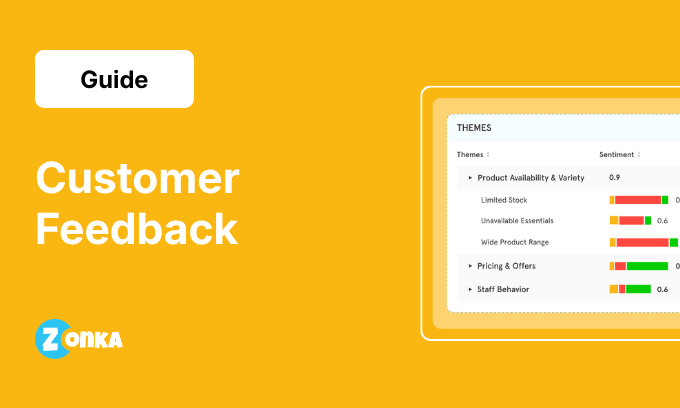
- Customer feedback is information customers share (directly or indirectly) about their experience: solicited surveys, unsolicited reviews, transcripts, and behavioral signals.
- Four collection moments matter more than channels: transactional triggers, relational programs, passive listening, and behavioral signals. Channel follows the moment.
- NPS, CSAT, and CES carry most of the operational weight. NPS measures the relationship, CSAT measures specific interactions, CES measures friction.
- Every feedback program sits on a five-stage maturity curve: Scattered, Collected, Analyzed, Routed, Predictive. Most plateau at Collected, where surveys run but nobody reads the comments.
- Most programs collect fine and break at the seam between data and decision. Loop closure rate, not response rate, is the real KPI.
- Manual analysis stops working past ~200 open-text comments a month. AI agents handle thematic clustering, sentiment, and entity-level mapping at scale.
Most teams think they have a customer feedback problem because they don't have enough of it.
The opposite is usually true. Surveys are running. NPS goes out quarterly. CSAT fires after every ticket. Reviews come in on G2 and Trustpilot. Support transcripts pile up in Zendesk. The product team has a Canny board. Marketing runs post-webinar polls.
The data is there. So why does it feel like nothing changes?
Because customer feedback doesn't fail at collection. It fails at the seam between data and decision, where thousands of comments are supposed to turn into a small number of clear, owned actions and almost never do. The score arrives. Nobody knows who's supposed to act on it. The open-text comments don't get read. The follow-up doesn't happen. Next quarter, the same numbers come back, and the same nothing happens.
This guide is about that gap. What customer feedback actually is. The four ways teams collect it. The three metrics that carry most of the work. How to analyze it at scale once the volume gets past what any human can read. And how to close the loop so the work doesn't stop at the spreadsheet. Running underneath all of it is a simple way to locate where your own program is stuck: a five-stage maturity model, from feedback that's merely scattered to feedback that predicts churn before the score drops.
What Is Customer Feedback?
Customer feedback is information customers share, directly or indirectly, about their experience with a product, service, or brand. It includes solicited responses (surveys, interviews, NPS scores) and unsolicited signals (reviews, social mentions, support transcripts, churn data, in-app behavior).
Customer feedback is broader than what most teams treat it as. It isn't just complaints, and it isn't just survey responses. A five-star Google review is feedback. A repeated support ticket about the same flow is feedback. A churned account's exit interview is feedback. The pattern of users abandoning your onboarding flow at step 4 is feedback, even though no customer ever typed a word.
What unites them is the same thing: information about the customer's experience that, if heard and acted on, can change what your business does next. The job of a customer feedback program isn't to collect the most responses. It's to surface the few signals worth acting on from the noise. And route them to people who can do something.
This is the foundation of any serious customer experience program and the input layer for Voice of Customer (VoC) work, which is the broader strategic system built on top of customer feedback. We'll come back to that distinction later, in the Voice of Customer section.
Types of Customer Feedback
Most articles list 10–20 "types of customer feedback": surveys, reviews, interviews, social media, support tickets. That's a list of sources, not types — it tells you where feedback comes from, not how to think about it.
A more useful frame: three axes that determine what the feedback can actually do for you.
Solicited vs Unsolicited
Solicited feedback is what you ask for. An NPS email, a CSAT survey after a ticket closes, an interview with a power user, a focus group, a post-onboarding check-in. You control the question, the timing, and (mostly) the audience.
Unsolicited feedback is what you didn't ask for. Reviews on G2, social media posts, support tickets that include complaints, comments inside your community, customers replying to a marketing email with grievances. You don't get to shape these. But they're often more honest because the customer chose to speak up without being prompted.
Programs that only run solicited surveys miss the most candid signals. Programs that only listen passively miss the structured comparable data you need to track trends.
Direct vs Indirect vs Inferred
Direct feedback comes straight from the customer in their own words: open-text survey responses, support transcripts, interview quotes, review content.
Indirect feedback comes through someone else: a sales rep relaying what a prospect said, a CSM summarizing an account meeting, a support agent noting a recurring complaint.
Inferred feedback comes from behavior, not words. Drop-off rates, feature usage patterns, time-to-renewal, churn cohort analysis. Nobody said anything. The data says everything.
Most teams trust direct feedback most because it feels closest to the source. But inferred feedback often catches issues earlier. By the time a customer takes the time to write a complaint, they've usually been frustrated for weeks.
Quantitative vs Qualitative
Quantitative feedback gives you scores: a 7 on NPS, a 4 on CSAT, a Likert rating, a percentage of customers who clicked the renewal button. Easy to track. Easy to chart. Hard to act on without context.
Qualitative feedback gives you the why: the open-text comment, the interview clip, the review paragraph. Hard to track. Hard to chart. But the only place where the actual reason for the score lives.
The most useful customer feedback programs collect both and connect them. A score tells you something changed. The comment tells you what.
Cross-Mapping Common Sources
Every source sits somewhere on all three axes:
| Source | Solicited / Unsolicited | Direct / Indirect / Inferred | Quantitative / Qualitative |
| NPS survey | Solicited | Direct | Both |
| G2 review | Unsolicited | Direct | Both |
| Support ticket | Unsolicited | Direct | Mostly qualitative |
| Sales rep call notes | Either | Indirect | Qualitative |
| Churn data | Inferred | Inferred | Quantitative |
| Post-call interview | Solicited | Direct | Qualitative |
Once you can place a source on the three axes, you can ask a useful question: what's missing? If everything you collect is solicited and quantitative, you have a score program, not a feedback program. The gap is usually in the qualitative and inferred quadrants, which is where the most interesting signals tend to live. For how this maps to data structure, see our guide on structured vs unstructured data.
Why Customer Feedback Matters
There are dozens of reasons given for collecting customer feedback. Three of them do most of the actual work.
It catches churn before your usage data does. Customers who are about to leave usually tell you first: in a low score, a frustrated comment, a feature request you keep dismissing. Usage drops are a lagging indicator. Feedback is a leading one. By the time the login frequency drops, the decision to leave was made weeks ago. Acting on that early signal is how feedback helps you retain customers who would otherwise churn quietly.
It tells your product team what to build next. Roadmaps built from internal opinions tend to drift. Roadmaps built from clustered customer feedback drift less: themes that show up across hundreds of comments, weighted by account size or segment, are usually right. Not every loud customer is right. But a pattern repeating across 30+ accounts almost always is.
It shapes how prospects decide. Reviews, ratings, and word-of-mouth are now the most-read part of any buying decision in B2B. Your G2 page, your TrustRadius profile, your social mentions. These are the feedback prospects use to evaluate you before they ever see your sales deck. Programs that drive reviews from happy customers, and recover detractors before they post, shape that landscape directly. Over time, that's a direct line to customer loyalty and business growth, not a soft brand metric.
The reasons that don't make the cut: vanity metrics for leadership decks, "customer-centric" positioning for marketing pages, generic "engagement." If a feedback program isn't doing one of the three things above, it's likely producing reports nobody acts on.
The Customer Feedback Maturity Model
Every company collecting customer feedback sits somewhere on the same path, whether they've named it or not. Most never name it, which is exactly why the program feels stuck without anyone being able to say why. Naming the stage is the fastest way to see what's actually missing.
Five stages. Each one is defined less by how much feedback you collect and more by what happens to it after it lands.
Stage 0: Scattered
Feedback exists, but in pieces. Support has CSAT in Zendesk. Sales keeps notes in Salesforce. Marketing runs the occasional poll. Reviews show up on G2 and nobody owns them. There's plenty of customer feedback data in the building. There's no picture. The tell that you're here: a customer flags the same problem in three places and no one notices, because no one holds the whole view.
Stage 1: Collected
Surveys run on a schedule. NPS goes out quarterly, CSAT fires after tickets, the data lands in one tool and sits. You can pull a score when leadership asks. What's missing is meaning. You know the number moved. You don't know why, because nobody's reading the open-text comments to find out. This is where most programs plateau. It looks like a feedback program because surveys are running. It behaves like a spreadsheet.
Stage 2: Analyzed
The comments get read at scale. Themes surface, sentiment gets tracked, the open-text field stops being a graveyard. You can say "34% of detractors this quarter mention onboarding" instead of "NPS dropped four points." You know what customers are saying. What's still missing: the insight reaches an analyst's slide, not the person who could fix the thing it's about. Knowing isn't acting.
Stage 3: Routed
This is the leap that separates programs that improve from programs that just measure. Every signal reaches a specific owner who can act on it, inside a window where acting still counts. A detractor on an enterprise account hits the CS lead's queue within the hour. A theme spiking across the support base becomes a ticket with a name on it. The loop closes back to the customer. Feedback stops being information and starts being work that gets done. Most companies never get here.
Stage 4: Predictive
The system flags risk before the score does. Feedback intelligence watches every comment, every shift in sentiment, every emerging theme, and surfaces the account about to churn while there's still time to keep it. You're no longer reacting to last quarter's numbers. You're acting on this week's signals. Few programs operate here today. It's where the category is heading.
| Stage | What it looks like | What's missing | The leap up |
| 0. Scattered | Feedback siloed across teams and tools | A single view | Centralize what you already collect |
| 1. Collected | Surveys run; data lands and sits | Meaning | Analyze the comments, not just the scores |
| 2. Analyzed | Themes and sentiment surfaced | Ownership of action | Route signals to people who can act |
| 3. Routed | Signals reach owners; the loop closes | Foresight | Detect risk before the score drops |
| 4. Predictive | Risk flagged before it shows in the number | The frontier | You're operating at the edge of the category |
Two honest notes about the model. Most teams overestimate their stage: running surveys feels like Stage 2, but if nobody's reading the comments, it's Stage 1 with good intentions. And you can't skip a stage. A team stuck at Scattered doesn't fix it with a better survey tool. It fixes it by centralizing what it already collects, then learning to read it. The rest of this guide is the path up: how to collect with intent, how to analyze at scale, and how to close the loop so the work doesn't stop at the dashboard. For the broader organizational version of this progression across every experience your company runs, see our take on experience management maturity.
How to Collect Customer Feedback
Most "ways to collect customer feedback" lists organize by channel: email, SMS, in-app, web, kiosk, phone. That's useful for vendor sales pages. It's not how to actually decide what to run.
Organize by intent moment instead. Ask what reason you're asking, and the channel decisions become obvious. There are four intent moments that cover most programs.
Transactional Triggers (Post-Event)
A customer just did something. Closed a support ticket. Finished onboarding. Bought a product. Attended a demo. Send a short, specific survey while the moment is fresh.
CSAT and CES live here. The trigger fires off an event (Salesforce case status changes, Stripe payment confirmed, HubSpot meeting completed) and the survey goes out within minutes to hours. Response rates drop sharply the longer you wait. A CSAT sent two hours after a ticket closes outperforms one sent the next day by a wide margin. Most useful as operational signal. The score attaches to a specific agent, a specific case, a specific product, a specific moment. That's what makes it actionable.
For the implementation patterns most teams use, see our guide on ways to collect customer feedback.
Relational Programs (Scheduled)
The customer hasn't done anything in particular today. You're asking about the relationship as a whole. NPS is the canonical example. Run quarterly, semi-annually, or at lifecycle milestones (post-onboarding, 6-month check-in, pre-renewal). Periodic customer interviews and focus groups belong to this moment too, when you want depth the survey can't reach.
Why a relationship cadence and not after individual events? Because the point isn't to capture the most recent interaction. It's to measure the overall sentiment about you. Running NPS after every support ticket is the wrong call (more on that in the common mistakes section below). Relational programs work best when they're consistent over time, so you can track movement: did this account's NPS drop after the contract change? Did the segment we expanded into score lower than the segment we've served for five years?
Passive Listening (Reviews, Social, Support)
The customer is talking about you whether you ask or not. Reviews on G2, Trustpilot, Capterra. Twitter/X mentions. LinkedIn posts. Threads in your community. Comments inside support tickets that weren't tagged as feedback but contain feedback.
Passive listening is the most underused source for most B2B teams. The signals are usually richer than survey responses because the customer chose to write them. The cost is that they're scattered across platforms you have to monitor, in formats you have to read, in volumes that quickly outpace manual review. Which is where analysis tooling stops being optional.
Behavioral Signals (Inferred)
The customer didn't say anything. The data did.
Drop-off rates inside your product. Customers who haven't logged in for 30 days. Renewal-period customers whose usage halved. Customer health scores that quietly slipped a band. The 8% of users who churned within 60 days: what did they have in common?
These signals catch the customers who never bother to fill out a survey or write a review. For SaaS especially, behavioral feedback is often the earliest warning system. The ones who are about to leave rarely tell you in words first. They just stop showing up.
Channel Choice Follows Intent
Once you know the moment, the channel mostly picks itself. Transactional triggers favor SMS and embedded email (speed matters). Relational programs favor email or in-app (longer windows are fine). Passive listening lives wherever your customers already talk. Behavioral signals live in your product analytics and CRM.
Where you collect from also shapes what you can ask. A short SMS handles one rating well. An in-app survey can ask for context on the specific website touchpoint the user just experienced. A relational program tied to customer journey touchpoints can compare the same metric across the lifecycle.
NPS, CSAT, CES: The Three Metrics That Do Most of the Work
Hundreds of customer feedback metrics exist. Three carry most of the operational weight. Each answers a different question, and most of the trouble comes from running the wrong one at the wrong moment.
NPS (Net Promoter Score): Relationship Loyalty
NPS measures the overall relationship. The question is the single one Fred Reichheld introduced at Bain & Company: "On a zero-to-10 scale, how likely is it that you would recommend this company [or this product] to a friend or colleague?" Promoters (9–10) minus detractors (0–6) gives you the score. Details on how to calculate it reliably are in Bain's loyalty-insights guidance.
Use NPS at relationship moments: post-onboarding, quarterly, pre-renewal, anniversary. Not after a single support ticket. The customer hasn't had enough surface area with you to give an honest answer to a relationship-level question, and the result comes back noisy.
Map NPS to the contact and account. Track movement over time. The absolute number matters less than the direction, and the segment-level breakdown matters more than the company average. That segment-level tracking over time is what dedicated Net Promoter Score software is built for.
CSAT (Customer Satisfaction): Specific Interaction
CSAT measures whether one specific thing went well. "How satisfied were you with your experience today?" on a 1–5 or 1–7 scale. It belongs after transactions: a ticket closed, an order delivered, a meeting completed, an onboarding call done.
CSAT is granular by design. The score attaches to a specific agent, a specific case type, a specific resolution time. That's what makes it the fastest signal for support teams. You can spot which queue is slipping or which agent needs coaching long before NPS would surface the issue.
CSAT is also where most teams over-survey. A 30-day suppression window fixes most of the fatigue problem: if a customer just answered, don't ask them again. Automating that suppression window is a standard feature of CSAT software.
CES (Customer Effort Score): Friction
CES measures effort. "How easy was it to resolve your issue today?" on a 1–5 or 1–7 scale. It's the metric most support teams should be running and usually aren't.
The research is striking. Matthew Dixon and colleagues at the Corporate Executive Board (now Gartner) published their findings in Harvard Business Review in 2010, based on a study of more than 75,000 customers. CES outperformed both CSAT and NPS as a predictor of loyalty in customer service interactions. Effort predicts repeat contacts and churn better than satisfaction does. The customer who got their issue resolved but had to escalate twice, switch channels, and repeat themselves three times is more likely to leave than the one who rated the interaction a 4 instead of a 5.
Put Customer Effort Score (CES) on support cases. Pair it with CSAT to see both axes: how well things went AND how hard it was. The pair tells you more than either alone.
Which Metric, When
| Moment | Metric | Why |
| Post-support-ticket | CSAT + CES | CSAT for interaction quality; CES for friction level |
| Post-onboarding | NPS + CSAT | NPS for the relationship; CSAT for the onboarding experience |
| Quarterly relationship check | NPS | Trend over time matters more than absolute number |
| Post-purchase | CSAT | Specific to the transaction |
| Pre-renewal | NPS | Relationship-level read before the renewal conversation |
| Post-product-update | CSAT or CES | CES if the update changed a workflow; CSAT for satisfaction |
If your program runs only one of the three, it's almost always NPS. That's fine for tracking the relationship but blind to operational friction. CSAT and CES are what give CX and support leads something to actually fix on Monday morning.
Building a Customer Feedback Strategy
Most "customer feedback strategy" guides give you ten steps. They look thorough and they all collapse at the same place: once the surveys are running, nobody knows what the strategy was actually for.
The useful frame isn't a step list. It's five decisions. Make them honestly upfront and a strategy holds. Skip them and you'll have a program that runs forever and informs nothing.
Decision 1: What question is the program answering?
Not "what do customers think." That's not a question. That's a wish. Real questions sound like:
- Why are mid-market accounts churning at twice the rate of enterprise?
- Is the new onboarding flow actually faster, or just shorter?
- Which support agents are creating repeat tickets?
- Is the recent pricing change costing us renewals?
A program built to answer a specific question collects different feedback, asks different things, and gets read by different people than a program built to "improve CX." The question shapes everything downstream.
Decision 2: Which moments deserve a survey?
Most teams send too many surveys. The fix isn't sending fewer. It's choosing the moments that actually carry signal.
Three filters: Did something specific happen the customer can react to? Is there someone on your team who would change behavior if the answer was bad? Will you actually look at the data within a week?
If all three are yes, survey. If any are no, the response will land in a dashboard nobody opens.
Decision 3: Who owns the response data?
The single most common failure mode in customer feedback programs is that nobody owns the data. Marketing runs the NPS program. Support runs the CSAT program. Product has a Canny board. Sales has post-demo surveys. Six people see scores. Nobody owns acting on them.
Pick the owner per metric. Per moment. Per segment if needed. NPS for enterprise accounts → CS lead. CSAT for support → support lead. CES on cases → support ops. Product feedback → product manager. Without ownership, every escalation becomes a meeting about whose job it was. With ownership, the meeting is about what to do.
Decision 4: How does a score become an action?
This is the seam where most programs break. A 3/10 NPS arrives. What happens next?
Three things have to be true. The score has to trigger something automatically (a Slack alert, a Salesforce task, an email to the account owner). The trigger has to land with a specific person who has time and authority to act. And there has to be a follow-up loop: did they act, what happened, did the score recover.
Programs that solve only the first two ("we created tasks!") end up with backlogs of orphaned follow-ups. Programs that solve all three close the gap between data and decision. The link between feedback silos and stalled CX programs is almost always rooted here.
Decision 5: How does the loop close back to the customer?
The forgotten piece. The customer who left the feedback has to know, eventually, that something happened with it. Not always in the form of "we changed the product because of your comment." Sometimes just "we read this, we're looking into it, here's what we found." A reply. A status note. A genuine thank-you when the change ships months later.
Programs that close the loop with customers retain more of them. Programs that don't slowly teach customers that feedback is theatre.
These five decisions sound simple. They're not, and they're rarely all made before the surveys start running. The teams that take the time to make them, and write them down, end up with feedback programs that survive leadership changes, tool migrations, and re-orgs. The ones that don't rebuild from scratch every 18 months. For a fuller worked example of strategy design, see our companion guide on customer feedback strategy.
How to Analyze Customer Feedback
Customer feedback analysis is where feedback programs actually generate value or quietly waste budget. It's also the Stage 1-to-Stage 2 leap in the maturity model: the point where collected data starts to mean something. Most teams collect well and analyze badly, and the gap has gotten worse, not better, as volume has grown. A support team handling 2,000 cases a month is now sitting on 600+ open-text comments per month, and nobody has time to read them.
There are four layers of analysis that matter. Get all four right and the program starts driving decisions. Skip any one and the system limps.
Manual Analysis: Where It Still Works (and Where It Doesn't)
Manual review is fine at low volume (say, under 200 open-text responses a month) when one person can read everything in a few hours and tag themes by hand. Past that, three problems compound: reviewers get fatigued and start skimming, different reviewers tag the same comment differently, and the volume keeps growing while review capacity doesn't.
By the time most B2B teams have meaningful NPS programs running, they're past the manual threshold. The choice isn't "manual or AI." It's "AI, or only sampling a tiny fraction of what came in." Teams that pretend otherwise end up with feedback programs that look comprehensive in slides and ignore 90% of what customers actually said.
Thematic Analysis: Patterns in Unstructured Comments
Thematic analysis clusters individual comments into recurring patterns. Instead of 600 separate responses, you see: 34% mention wait time, 22% mention resolution quality, 18% reference the same product bug, 8% complain about the renewal process.
The themes themselves are what gets acted on. "Wait time" isn't a comment to respond to. It's a roadmap input. The 18% who mention the same bug is a P0 ticket. The renewal complaints flag a process problem.
What makes thematic analysis hard to build well is that the themes have to be specific enough to be actionable. "Customer service" as a theme is useless. Every comment is about customer service in some sense. "Wait time on the phone queue specifically during 2–4pm ET" is something you can fix.
Pattern recognition like that is where AI-driven analysis substantially outperforms keyword counting. Variations across phrasing ("took forever," "kept me waiting," "long hold," "no response for hours" all map to the same theme) are genuinely hard to do manually at scale. Recognizing them automatically is what thematic analysis software does in seconds.
Sentiment Analysis: What the Score Doesn't Say
Sentiment analysis catches what numerical scores miss. A 4/5 CSAT that says "I guess it was fine but I still don't understand why this keeps happening" isn't really a 4. The customer is frustrated. The score is forgiving. The underlying feeling is not.
Sentiment analysis lives in the gap between the rating the customer left and the words they wrote. A high score with negative sentiment is an at-risk account hiding in plain sight. A low score with neutral sentiment is often a one-off problem, not a relationship issue.
Done well, sentiment analysis flags the high-score / negative-language combination automatically. Done badly, it just attaches a smiley or a frown to each comment and adds nothing. The difference is whether the system reads tone in context, the way a senior CS lead would read a customer email, or just matches positive/negative words against a dictionary. Our sentiment analysis on customer feedback guide walks through the distinction.
Entity-Level Analysis: Connecting Feedback to Your Business
The most underused layer. Entity-level analysis maps each piece of feedback to the parts of your business it's actually about: the specific agent, the specific feature, the specific location, the specific touchpoint, the specific account.
Without it, you have themes and sentiment but no idea what to do with them. With it, the signal arrives with context. For a support org, this is what makes the difference between "CSAT is down this quarter" and "CSAT is down 8 points in the West region, driven by a 12-point drop in the renewals queue, primarily on cases handled by [three named agents]." The first is a slide. The second is a coaching conversation tomorrow morning.
Conversational Querying: Ask AI
The newest layer. Once themes, sentiment, and entities are mapped, anyone in the organization can ask the system questions in plain language. "What are the top three drivers of detractor responses among enterprise accounts this quarter?" "Which agent has the highest CES on technical tickets in the last 30 days?" "What changed in product feedback after the v3.0 release?"
This is what changes feedback analysis from a quarterly report exercise to an on-demand decision tool. The CS lead doesn't have to wait for the next analyst report. The PM doesn't have to file a data request. The signal is there when the question is asked.
The full picture (themes, sentiment, entities, conversational access) is what Zonka Feedback's AI Feedback Intelligence layer is built to do. AI agents monitor feedback continuously, surface signals when patterns shift, and route them to the people who can act. Not "AI-powered dashboards." Agents that read every comment, every score, every shift, and send the right person the right signal at the right moment.
For how each analysis layer connects to operational metrics, see our Voice of Customer analytics guide.
Closing the Customer Feedback Loop
Closing the loop is the operational discipline that turns survey responses into action. It's the Stage 3 move in the maturity model, and it's the part of feedback programs most teams quietly skip. The score arrives. The dashboard updates. Nothing else happens. The customer who flagged the problem never hears back. The agent who caused the friction doesn't get coached. The pattern across 30 detractors doesn't become a P0 fix.
A real feedback loop has four steps. Skip any one and the program quietly breaks.
Detect
A response comes in. The system has to classify it fast (promoter, passive, or detractor for NPS; high vs low for CSAT or CES) and flag the ones that need attention. At scale, this is automated; manually triaging hundreds of responses doesn't scale and creates lag.
Route
The flagged response has to land with someone specific. A detractor on an enterprise account → CS lead. A low CSAT on a support ticket → the agent's manager. A negative comment about a feature → the relevant PM. Routing depends on who owns acting, which is Decision 3 in the strategy section above. The whole loop falls apart if this step is fuzzy.
For loop architecture specifically, our close the feedback loop guide and the ACAF framework (Ask, Categorize, Act, Follow-up) walk through implementation. Automating those routing and recovery steps is what closing the customer feedback loop looks like when it runs on its own.
Recover
The assigned person follows up within a defined SLA window. Typically 48 hours for detractors, sometimes 24 for high-severity cases. The follow-up isn't always "we fixed it." Sometimes it's "we read this, we're investigating, here's what we'll know by Friday." The point is contact. The customer who feels heard converts back to passive or promoter at a meaningfully higher rate than the one who feels ignored.
Measure
Did the detractor become a passive next quarter? Did the at-risk account renew? Did the CSAT recover after the agent coaching? Loop closure rate is the real KPI here, not response rate. That's the percentage of low scores that triggered a follow-up that landed within SLA.
Response rate tells you how many people answered. Closure rate tells you whether the program is doing its job. A program with 40% response rate and 5% closure rate is collecting data and discarding it. A program with 18% response rate and 80% closure rate is actually changing outcomes.
The shift from "track NPS" to "close the loop on NPS" is what separates teams that improve from teams that just measure.
Customer Feedback Management as a System
Customer feedback management is the shift from "we run surveys" to "feedback is an operating system the company runs on." It's the difference between a feedback program that lives in one team's tool and one that connects scores, comments, tickets, and CRM records into a single intelligence layer every team can act from.
The shift matters because most companies don't have a feedback problem at the input layer. They have a fragmentation problem at the system layer. Surveys live in one tool. Reviews live somewhere else. Support tickets in Zendesk. Sales notes in Salesforce. Product feedback in Canny. Each tool collects its slice. None of them talk to each other. The result is a common pattern: a customer flagged the same problem in three places, and nobody noticed because nobody had the view.
Three structural elements make customer feedback management work as a system rather than a stack of tools.
Centralization. Survey responses, review content, support transcripts, social mentions, and product feedback have to land in one place that's queryable. Not a quarterly export. Not a spreadsheet someone maintains manually. A live system where the question "what did our top 10 accounts say in the last 30 days" returns an answer in seconds.
CRM integration. Feedback that doesn't tie back to the customer record is feedback you can't act on operationally. CSAT scores need to attach to cases. NPS needs to live on the contact and account. Sales call notes need to surface alongside renewal data. The work to set this up once pays back every time a CS lead opens an account and sees the full picture instead of guessing. Our guide on integrating CRM and customer feedback management covers the technical patterns most teams use.
Cross-team accessibility with role-based signals. A support lead doesn't need to see product roadmap themes. A PM doesn't need queue-level CSAT. A CCO does need both, aggregated. The system has to deliver the right slice to the right role automatically. Every team gets their signals. Nobody gets buried in everyone else's.
When these three are in place, customer feedback stops being a CX team's responsibility and becomes shared organizational infrastructure. Managing customer feedback shifts from a periodic reporting chore to a continuous operating rhythm. For a deeper look at how the ACAF framework structures this operationally, see customer feedback system.
How Customer Feedback Connects to Voice of Customer
Customer feedback and Voice of Customer get used interchangeably. They shouldn't be.
Customer feedback is the data input: the surveys, reviews, comments, transcripts, behavioral signals. Voice of Customer is the strategic program built around that input. VoC defines what gets collected, who owns it, how it gets analyzed, how it feeds product, support, and CX decisions, and how outcomes get measured.
Put another way: every Voice of Customer program runs on customer feedback. Not every customer feedback program qualifies as VoC.
The difference is whether there's a coordinated organizational system or just scattered survey programs. A team running an NPS quarterly without anyone formally owning the response data has a customer feedback program. A team running NPS plus CSAT plus product feedback plus support sentiment analysis, with clear ownership, defined response SLAs, regular reporting to the executive team, and an annual review of what changed because of it, has a VoC program. In maturity-model terms, VoC is what a program looks like once it's operating reliably at Stage 3 and reaching toward Stage 4.
For most companies, the path is the same: build the customer feedback foundation first (collection working, analysis working, loop closing), then evolve into a VoC program by adding ownership, governance, and cross-team accountability. The deeper foundations of the discipline, including its origin in Griffin and Hauser's 1993 Marketing Science paper, are covered in our guide to what Voice of Customer is.
Common Customer Feedback Mistakes
The same six mistakes show up across most customer feedback programs. None of them are about the tools. All of them are about how the program is structured. Avoid them and you skip months of pain.
1. Sending NPS After Every Support Interaction
NPS measures relationship loyalty. CSAT measures interaction satisfaction. Fire NPS after a single ticket and you're asking a customer to rate the relationship based on three minutes with a support agent. The answer comes back noisy. Use CSAT (or CES) for the interaction. Save NPS for relationship moments.
2. Treating Response Rate as the Success Metric
A 40% response rate on a survey nobody acts on is worse than useless. It's evidence that you have a measurement program, not a feedback program. The actual KPI is loop closure rate: what percentage of low scores triggered a real follow-up that landed within SLA, and what percentage of those follow-ups resolved the customer's underlying issue.
3. No Closed-Loop Process
The most common failure mode. The score arrives. The dashboard updates. Nobody is assigned to act. Six months later, the same complaints reappear in the next quarterly NPS report and someone says "we should really do something about this." Nothing changes. Programs without explicit ownership and SLAs for follow-up don't survive the second leadership change.
4. Survey Fatigue (Running NPS + CSAT + CES Simultaneously Without Throttling)
Three metrics. Three surveys. To the same customers. Within a 30-day window. Response rates collapse across all three and the customers start treating your emails as noise. The fix is straightforward: implement a 30-day suppression rule. If a customer answered any survey recently, the next one waits.
5. Ignoring Unstructured Comments
The open-text field is where the actual reasons live. The score tells you something changed. The comment tells you what changed and why. Programs that report on the number and look at the words only when leadership asks miss most of what customers are actually saying. The shift from "score-tracking" to "comment-reading" is what makes feedback useful operationally, and it's only possible at scale with the analysis layer covered in the analysis section above.
6. Building the Program Before Defining the Question
This one is the upstream cause of all the others. Teams pick a tool, pick a metric, pick a frequency, and start sending surveys before anyone has written down what business question the program is supposed to answer. Without that question, the data has nowhere to land, and without somewhere to land, nobody acts. The five decisions in the strategy section prevent this — they take a half-day to make and save years of program drift.
A deeper diagnostic of what goes wrong in larger feedback programs is in our why your VoC program is failing guide.
Customer Feedback Tools and Software
Customer feedback tools and software split into three categories that look similar in marketing material and behave very differently in practice. Picking the wrong category is one of the more common reasons feedback programs stall. Most teams pick a collection tool when they actually need an intelligence platform, or pick an enterprise platform when they need something they can launch in a week.
Collection platforms focus on the survey layer. Send surveys across email, SMS, in-app, web, kiosk; collect responses; show scores in a dashboard. SurveyMonkey, Typeform, Google Forms sit here. The ceiling shows up the moment you have more comments than one person can read.
Analysis and intelligence platforms focus on what happens after the response: thematic clustering, sentiment analysis, entity mapping, anomaly detection, signal routing. This is the layer that separates basic customer feedback software from a real intelligence system. Useful for teams already collecting at volume who can't keep up with what's coming in.
Integrated platforms do both: collection across channels plus AI-driven analysis plus closed-loop workflows in one system. Zonka Feedback sits here, alongside Qualtrics and Medallia at the enterprise tier. The trade-off is one more system to learn versus wiring two or three tools together. The full evaluation across categories is in our deep-dive on customer feedback tools.
If you want to start with the survey foundation first, a ready-made customer feedback survey template works inside any of the platforms above.
The category labels don't capture what actually changes between platforms: not the survey, but what happens after it. Two platforms can collect the same NPS response identically. One sends the score to a dashboard. The other catches the sentiment under the score, maps it to the account and the responsible CSM, flags emerging themes across the segment, and routes a signal before anyone in your org has logged in to look. That second behavior is what AI agents are starting to do, and it's what's redrawing the category.
The Real Work Starts After the Score Arrives
Most teams don't have a customer feedback problem at the collection layer. They have one at the seam where data is supposed to become decision and quietly doesn't.
The score arrives. The dashboard updates. The comment sits in an open-text field nobody opens. The detractor never hears back. The pattern across 30 accounts doesn't become a P0. Next quarter, the same numbers, the same nothing.
What changes the pattern isn't another survey. It's the work after: who owns the response, how it gets routed, when the follow-up lands, what gets read at scale and what gets acted on. That's the climb from Collected to Routed, and it's operational, not analytical. The tools just make it possible.
Whenever you're ready to see how AI agents handle the analysis and routing layer specifically, Zonka Feedback's AI Customer Feedback & Intelligence Platform is built around the four steps of closing the loop.

.png)
.png)