


.svg)
 Healthcare
 Finance
 Retail
 SaaS & Digital
 eCommerce
 Education

 Salesforce
  HubSpot
 Pipedrive
 Mailchimp
 Zendesk
  Freshdesk
 HelpScout
  Front
Front Slack
Slack  Zoom
Zoom Google Sheets
  Zapier
  Integrately
 Webhooks
  Blogs
Blogs Webinar
 Product Updates


TL;DR
- User experience surveys measure how easy, clear, and satisfying specific product interactions feel, not just overall sentiment.
- Run them after task completion, on exit intent, or after a feature is first used. Those moments produce the highest-quality responses.
- For standardized benchmarking, SUS (10 items), UMUX-Lite (2 items), and SEQ (1 task-level item) are the instruments product teams reach for most. You don't need all three; pick based on what you're measuring.
- A good SUS score is 68 (industry average). Scores above 80 are excellent; below 50 signal serious usability problems that need immediate attention.
- UX surveys and usability testing serve different purposes. Surveys scale across hundreds of users and measure perceived experience. Testing observes actual behavior. Use both, but don't confuse them.
Most product teams know something is wrong before they can prove it.
Activation rates dip below projections. A feature ships and adoption is flat. The in-app onboarding flow looks fine in session recordings — users click through, they complete steps. But something is breaking anyway. Analytics show the drop-off point. They don't tell you why.
That's the gap user experience surveys close. As a focused method within the broader product feedback guide framework, they capture what behavioral data can't: what users were trying to accomplish, whether they felt like they succeeded, and where the friction was invisible to your tracking setup but very visible to the person experiencing it.
This guide covers the question frameworks product teams actually use, how to design surveys that produce decisions rather than reports, and the metrics that make UX data comparable across releases and cohorts.
What Are User Experience Surveys?
A user experience survey is a structured set of questions that gathers feedback on how users perceive and interact with a product, feature, or interface. The goal isn't to measure satisfaction in the abstract. It's to understand whether a specific interaction worked the way you intended, and whether users felt capable and clear while doing it.
UX surveys combine quantitative data (rating scales, standardized instruments like SUS and SEQ) with qualitative data (open-ended questions about what happened and why). That combination is what makes them useful: scores tell you where experience is degrading, and open responses tell you what to actually fix.
For product teams, UX surveys are most valuable at three moments: after a significant feature launch (did the experience land?), during an active iteration cycle (which version worked better?), and periodically as a benchmark (is overall product experience trending up or down?).
UX Surveys vs. Usability Testing: When to Use Each
These two methods answer different questions. Mixing them up is one of the most common research planning mistakes product teams make.
UX surveys are scalable and asynchronous. They collect self-reported experience data from a large number of users, often dozens or hundreds, without requiring a researcher in the room. They're strong for benchmarking over time, measuring perceptions across a full cohort, and understanding why a quantitative metric moved.
Usability testing is observed and moderated. A researcher watches a real user attempt a real task and documents what actually happens, including behavior the user wouldn't think to mention in a survey. It's the right tool for pre-launch validation of complex workflows and for catching problems you don't yet know to ask about.
The practical rule: if you know what questions to ask, run a survey. If you don't yet know what's going wrong, observe first. Most mature product teams run both.
Why UX Surveys Matter for Product Teams Specifically
Product analytics are good at showing you what happened. A funnel chart tells you 34% of users dropped off at step 3. That's useful, but incomplete. Analytics can't tell you whether users were confused, discouraged, distracted, or simply not motivated enough to continue. Those four causes have four completely different fixes.
A mid-stage B2B SaaS team (around 120 users in the onboarding cohort) running post-onboarding SEQ surveys found their setup flow had a 41% abandonment rate at the integration step. The step looked functional in all behavioral data. Survey responses revealed users weren't sure their changes had saved; there was no confirmation state on the screen. One design change raised task completion scores from 4.1 to 6.2 on a 7-point scale in the following cohort. The fix took two days. Finding it without the survey would have taken considerably longer.
That's the practical case. UX surveys surface the signal that sits between behavioral data and the actual problem.
User Experience Survey Questions by Research Goal
Using the wrong question type for the wrong goal produces data that doesn't answer anything. The categories below map question frameworks to specific research objectives. Choose the category that matches what your team is actually trying to learn, not the one that seems most thorough. For broader question banks covering product feedback questions and product survey questions beyond UX-specific measurement, those guides cover the full range.
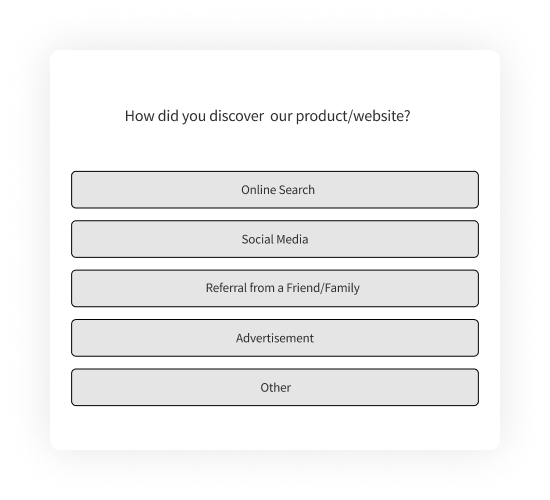
1. User Persona Questions
These questions build the foundation for everything else. Before you can design a better onboarding flow or prioritize feature work, you need to know who your users actually are: what they're trying to accomplish, what alternatives they considered, and how they think about the product in their own words. The answers inform positioning, personalization, and ICP refinement, not just UX decisions.
- What do you aim to achieve by using our product?
- Which of our competitors did you consider before choosing us?
- What specific reasons influenced your decision to choose our product over alternatives?
- How would you describe our product in one word or sentence?
2. UX Research Questions
These work best as a follow-up to a quantitative signal: a drop in product experience scores, a spike in support tickets around a specific feature, or low adoption of something you expected to land well. They answer why, not just what. Run them after you've identified a problem area, not before.
- How frequently do you encounter this challenge when using our product?
- Have you tried any alternative approaches to solve this problem?
- How much time have you spent dealing with or working around this issue?
- Have you explored other tools trying to address a similar challenge?
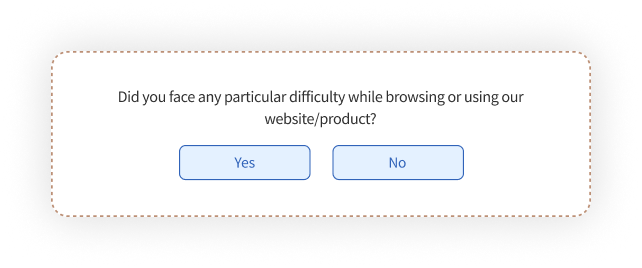
3. UX Testing Questions
Use these after a user attempts a specific task, not as a standalone survey but as a follow-up to an actual interaction. The value here is specificity. Ask about what just happened, while it's fresh. Broad satisfaction questions asked days after a feature interaction produce much weaker data than targeted questions asked within minutes of task completion.
- Were you able to accomplish what you set out to do?
- What difficulties, if any, did you run into?
- Were there any elements or features that felt particularly intuitive or easy to use?
- Did you notice any bugs, glitches, or unexpected behavior?
- What changes would most improve this experience?

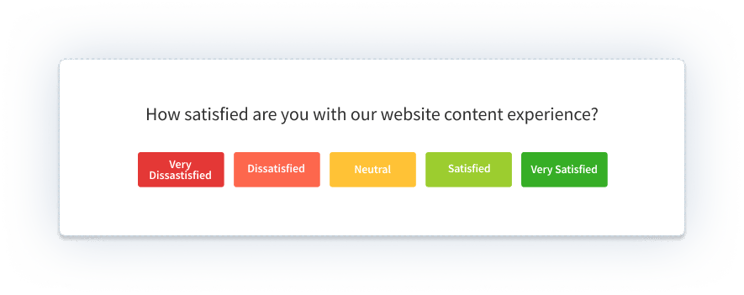
4. Content Experience Questions
In a product context, "content" means more than marketing copy. It means empty states, error messages, onboarding instructions, in-app tooltips, and the microcopy that guides users through complex workflows. Bad product copy creates more user confusion than bad design, and it's almost always invisible in behavioral analytics. These questions surface it.
- Were you able to find the information you needed without difficulty?
- How useful did you find the instructions or guidance at this step?
- What types of help content (tooltips, examples, guides) did you find most valuable?
- How relevant was the information to what you were actually trying to do?
- What would make this content clearer or more useful?
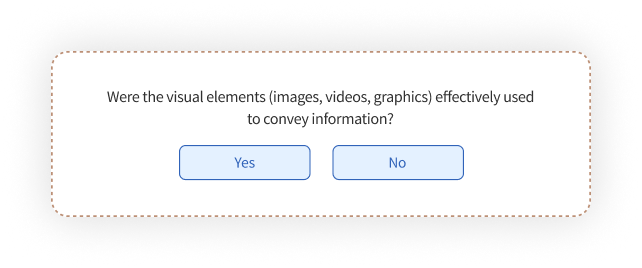
5. Visual and Interaction Design Questions
Visual design questions aren't really asking whether the product looks good. They're asking whether the visual hierarchy supports the task: is the thing users need to click obviously clickable, does the layout create the right attention flow, does interaction feedback (states, transitions, confirmations) tell users what they need to know. "Looks good" is the wrong standard. "Guides me clearly" is the right one.
- How visually clear did you find the layout and structure of this screen?
- Did the color choices and typography help or hinder your navigation?
- How well did the visual hierarchy guide your attention toward what mattered?
- How much did the visual presentation affect your confidence while completing this task?
6. Post-Onboarding and Feature Adoption Questions
These are most valuable in the 0–30 day window after a user first encounters a feature or completes initial setup. Churn risk is highest here. The experience is freshest here. And the problems you find at this stage (ambiguous instructions, missing confirmation states, unclear context) are almost always fast to fix once you know they exist.
- Was it clear what this feature was for when you first saw it?
- How confident did you feel completing the setup process?
- What, if anything, almost stopped you from finishing?
- How easy was it to find this feature when you needed it?
- Is there anything about this feature you wish someone had explained before you started?
For measuring whether users would miss the product altogether rather than evaluating a specific interaction, a product-market fit survey uses a different framework designed specifically for that question.
7. Customer Satisfaction Questions
In a product context, CSAT measures satisfaction with a specific interaction or feature, not the brand overall. That distinction matters. A user can love your product and still be frustrated by one particular workflow. These questions identify where that friction lives, so you can separate product-level satisfaction from interaction-level friction and address both correctly. For measuring relationship-level loyalty alongside interaction satisfaction, pair these with an NPS question on a different cadence.
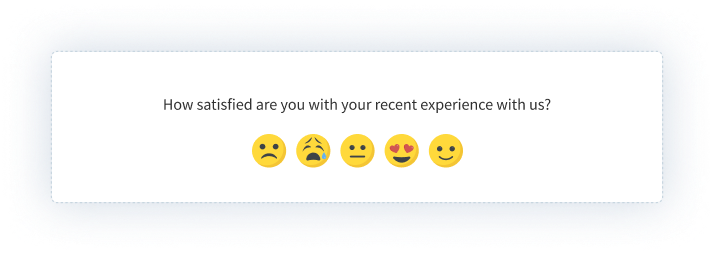
- On a scale of 1 to 10, how satisfied are you with your experience with our product today?
- Did our product meet or exceed what you expected it to do?
- How would you rate the overall quality of this experience?
- What improvements would most increase your satisfaction with this part of the product?
8. In-App and In-Product UX Questions
In-product UX surveys operate under different constraints than website surveys. They interrupt an active session. Brevity isn't a nice-to-have; it's the difference between a response and an ignored prompt. Keep in-product surveys to 1–2 questions per trigger. Time them to post-task moments, not mid-task interruptions. Ask about what just happened, not about general impressions.
- How easy was it to complete what you were trying to do just now? (1–7 scale)
- Was there a moment where you weren't sure what to do next?
- Did the product behave the way you expected when you completed that action?
- What's one thing that would have made this experience faster or clearer?
- Overall, how easy was this task? (SEQ format, 7-point scale)
For how to deploy these surveys inside your product or mobile app, including trigger logic, SDK setup, and display rules, see our guide to in-app surveys. Running UX surveys in a mobile context? See mobile app surveys for platform-specific considerations.
Ready to run a UX survey? Use our pre-built user experience survey template: question structure already built for product teams, with branching logic and response routing included.
How Do You Design UX Surveys That Drive Product Decisions?
Whether a UX survey generates a report or generates a decision comes down to how it was set up, not how the data was analyzed. Survey design determines response quality. And response quality determines whether you learn something useful.
Step 1: Start With a Decision, Not a Topic
Most teams start with "let's understand how users feel about X." That's a topic, not a decision. Before writing a single question, name the specific decision your team needs to make. Should we simplify the onboarding flow or add more guidance? Should we surface this feature earlier in navigation? Should we invest engineering time in this workflow or deprioritize it?
The decision determines which questions you ask and which users you ask them to. A survey designed to answer "how do users feel about the product" collects everything and informs nothing. A survey designed to answer "do users understand what the integration step is asking them to do" collects exactly what you need.
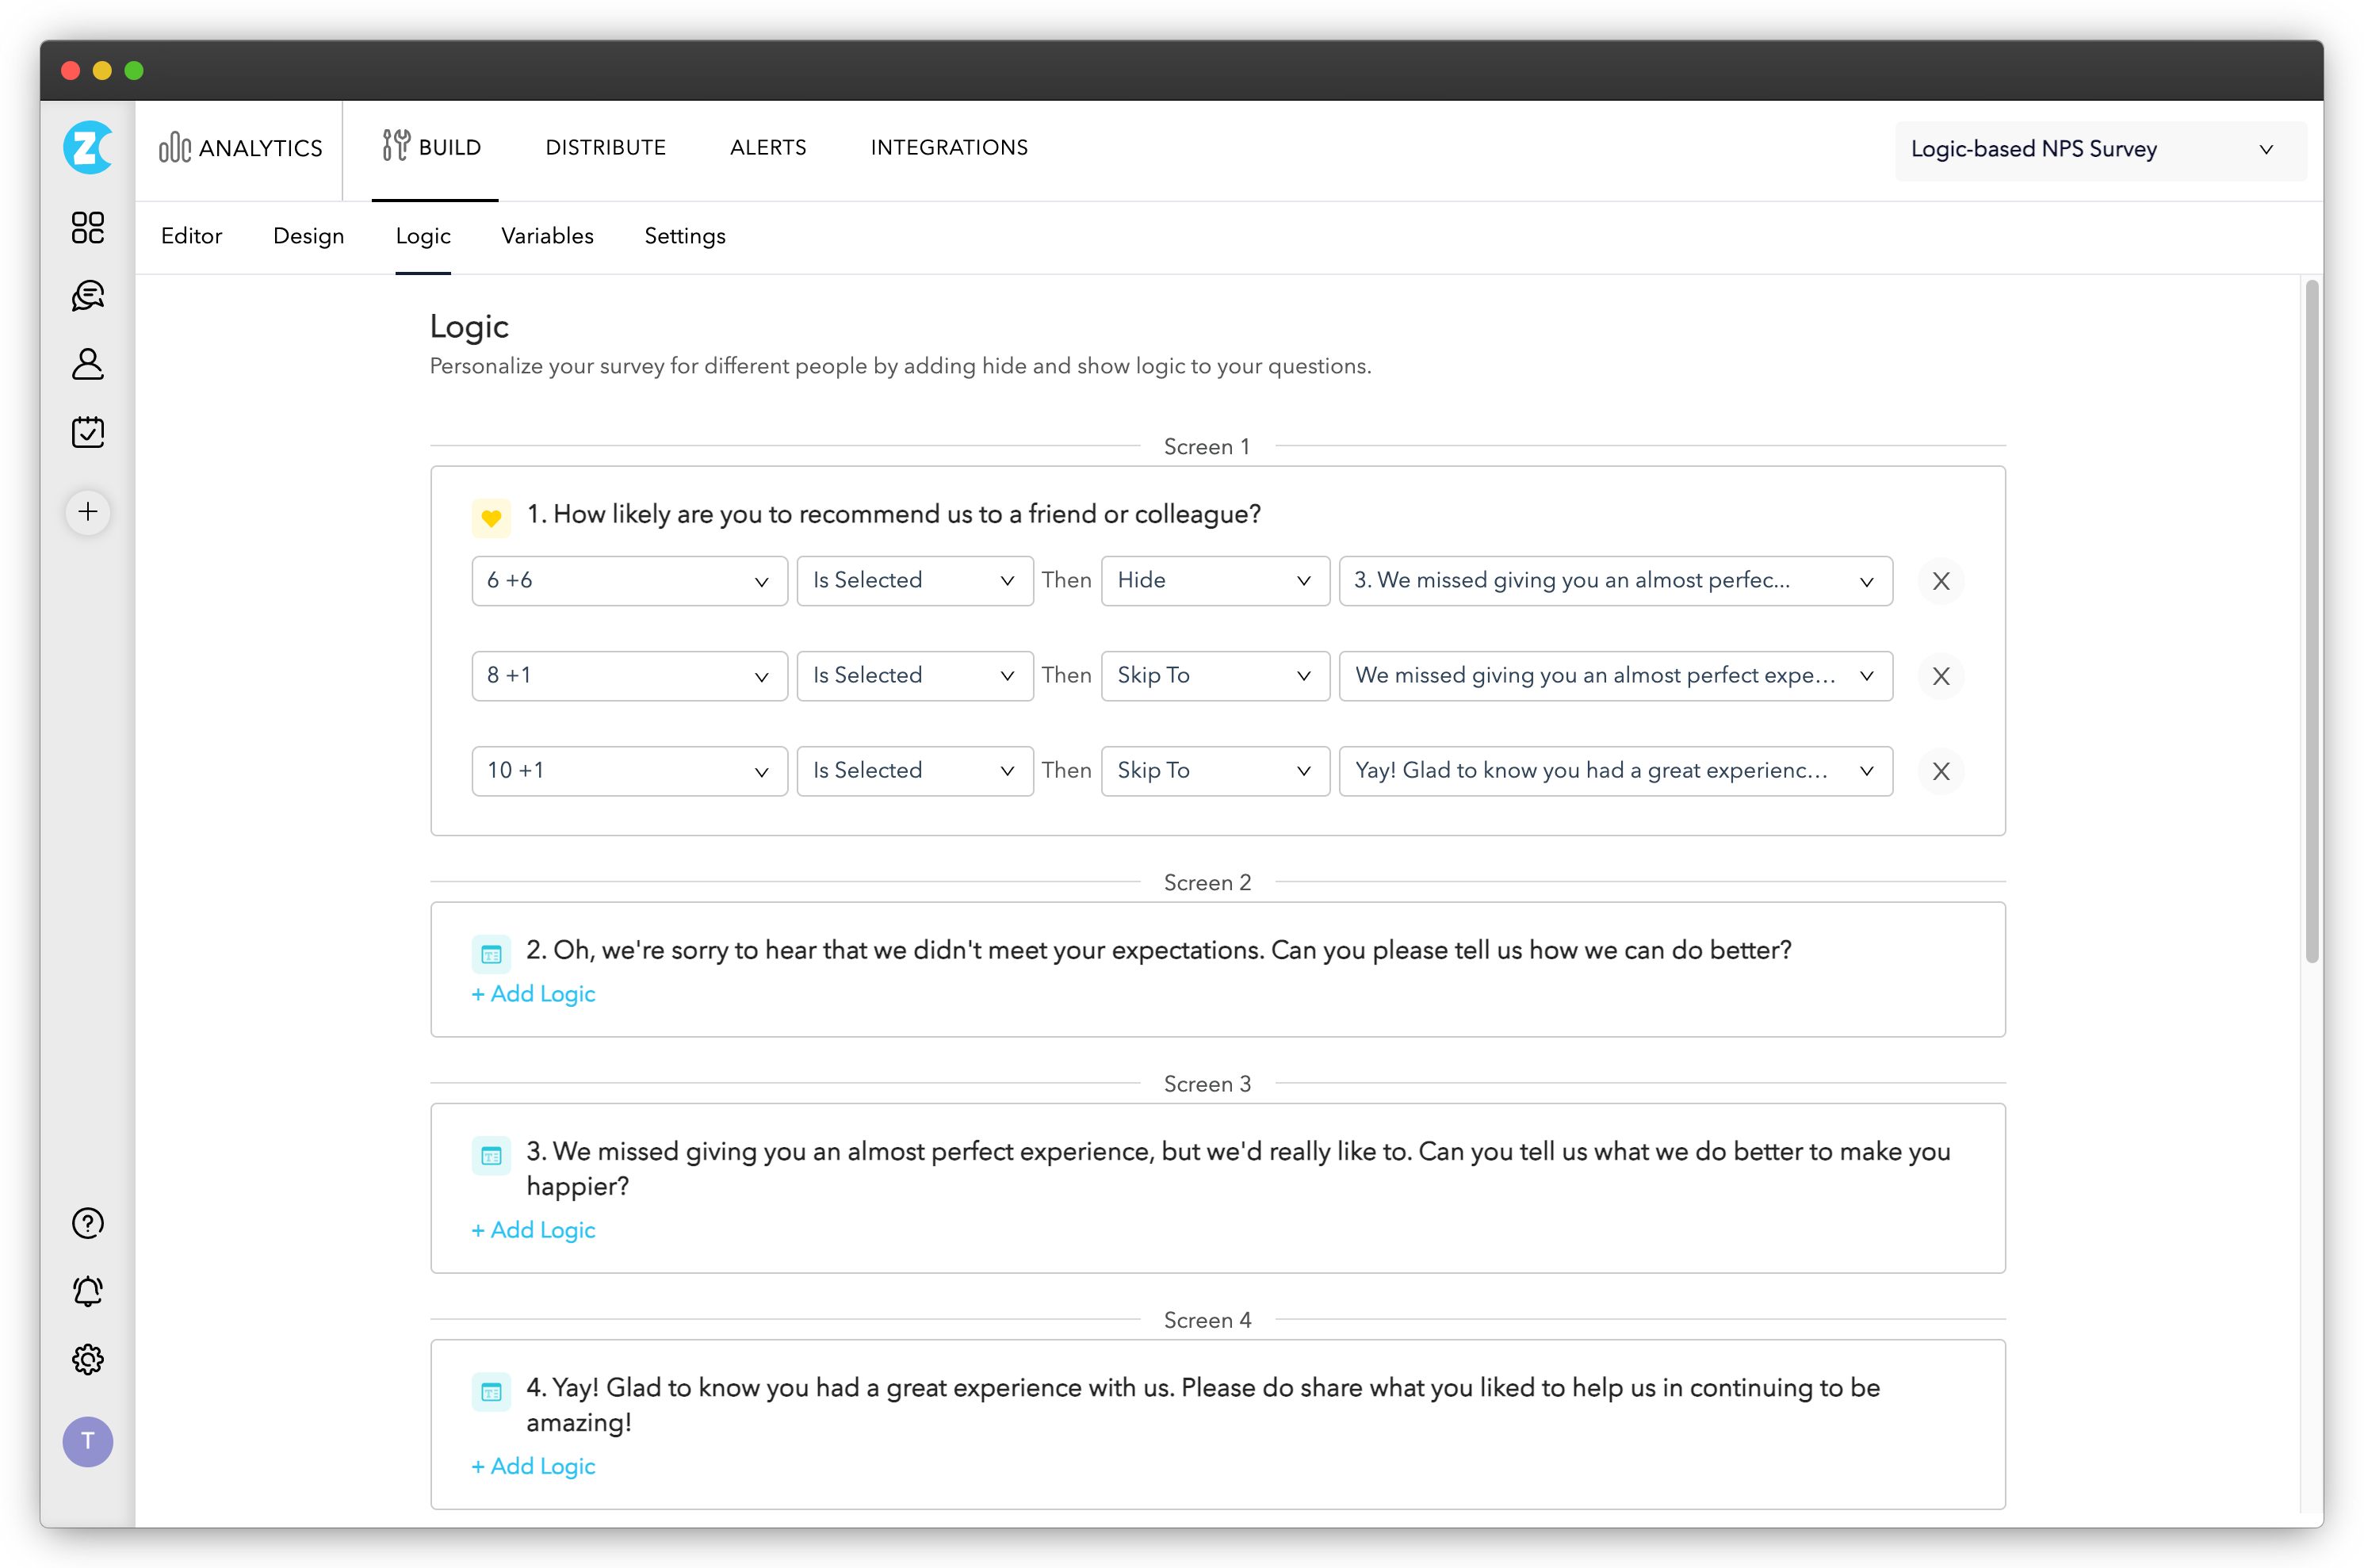
Your tool matters here. You need something that supports event-based triggers (survey fires after a specific in-product action), branching logic (different follow-up questions based on ratings), in-product deployment, and response routing to the right team. In Zonka Feedback, this means configuring a CES slide-up that fires after a user completes a specific workflow, passing variables like feature name and usage count so you can segment results without manual tagging. The AI analysis layer then clusters open-text responses into themes automatically, so your team reads patterns, not individual comments.
Step 2: Write Questions That Produce Usable Data
A few principles that consistently make a difference:
Mix question types deliberately. Closed-ended questions (rating scales, multiple choice) give you quantifiable data you can track over time. Open-ended questions give you the why behind the scores. A 4/5 CSAT score with no follow-up question is half a data point. Add "What could we have done to make this a 5?" and it becomes something you can act on.
Always follow up rating scale questions. The open response is where most of the value lives. Users who gave a 3/10 have something specific to say. Give them the space to say it.
Personalize where you can. Showing the same generic survey to a brand-new user who just completed onboarding and a power user who's been in the product for 18 months produces weaker data from both. User segmentation lets you target by behavior, lifecycle stage, or feature usage so questions actually fit the person answering them.
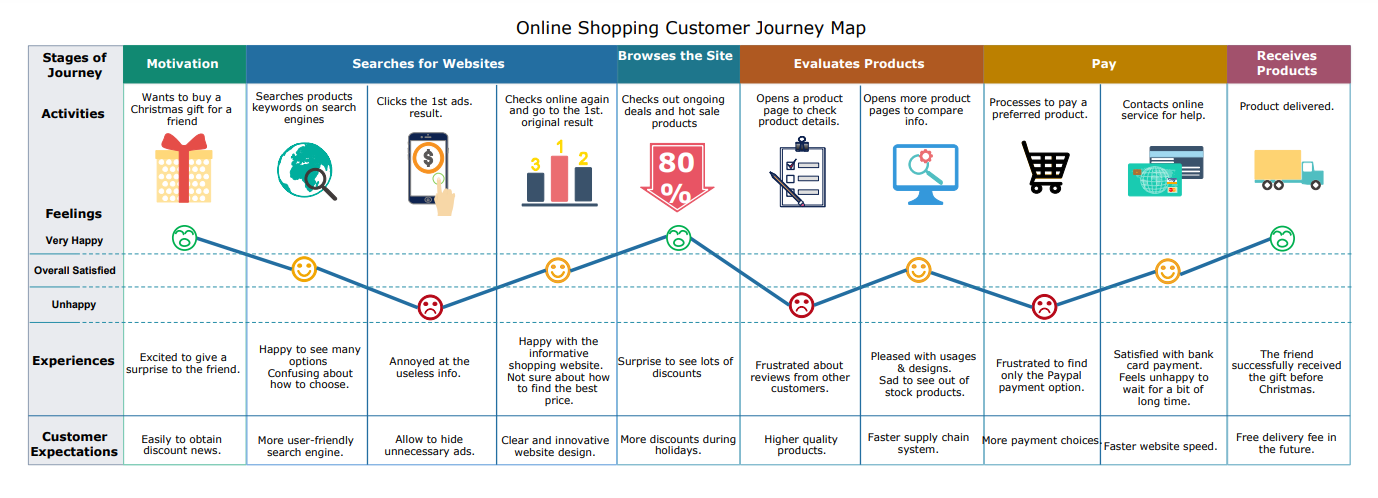
Step 3: Map Questions to the Product Journey
Website surveys and product surveys follow different journey maps. For product teams, the relevant stages are:
- Trial or first login: first impressions, initial orientation, whether the product's value is immediately clear
- Onboarding: task completion confidence, instruction clarity, perceived complexity of setup
- Feature activation: whether users understood the feature's purpose, whether they felt capable using it
- Retention and re-engagement: long-term satisfaction, feature gaps, what keeps users coming back or drives them away
Each stage warrants different questions. A survey at first login should measure orientation and clarity. A survey 14 days post-activation should measure whether the feature delivered on its promise. Sending the same questions regardless of where someone is in their product journey produces noisy data that's hard to act on.
Step 4: Time the Survey to the Experience
Timing is where most in-product UX surveys fail. Ask too early and users haven't experienced enough to respond meaningfully. Ask too late and the specifics have faded.
Three triggers that consistently produce high-quality responses:
- Post-task completion: the survey fires immediately after a user completes a specific action. This is the highest-signal moment. The experience is fresh and the user has just demonstrated engagement. In practice, this might mean a slide-up that triggers after a user has used a feature three times, passing the feature name and usage count as variables so results are segmented from the start.
- Exit intent: captures honest feedback when a user is about to leave. Useful for understanding abandonment, but frame the question carefully.
- Time-based triggers after meaningful engagement: if a user has spent significant time on a specific feature, that engagement is worth learning from.
The 30-second rule for in-product surveys: always trigger after the user has completed an action, never during it. Interrupting mid-task is the fastest way to get abandoned surveys and frustrated users.
Step 5: Diversify Feedback Collection Channels
No single channel captures the full picture. In-product surveys catch users at high-engagement moments. Email surveys reach users who've stepped back and can reflect more broadly. Always-on feedback buttons give users a place to volunteer feedback you didn't think to ask for, and that passive channel often surfaces issues that targeted surveys miss entirely.
Both channels matter in different ways. Passive channels (feedback buttons, always-on prompts) surface what users think is important enough to volunteer. Active channels (triggered surveys, email sequences) surface how users respond to specific experiences you're testing. Both are useful. Neither is sufficient alone.

What Do You Do With UX Survey Results?
A survey is only useful if it produces a decision. That sounds obvious. And yet plenty of well-designed surveys end as slide decks nobody acts on. Here's how product teams close that gap.
Analyze Results With a Framework, Not Just Instinct
Start with score distribution: what percentage rated 6 or below? Then segment by user type or lifecycle stage. Do new users score the experience differently than established ones? Then read open responses for the lowest-scoring cohort first. That's where the specific, fixable problems live.
For standardized instruments like SUS, you have an external benchmark. Based on Jeff Sauro's research at MeasuringU, the industry average SUS score across products is 68. Above 80 typically signals excellent usability. Below 50 points to serious problems that go beyond surface-level fixes and usually indicate fundamental navigation or information architecture issues. If your score sits in the 50–67 range, you have real work to do, and the open-text responses will tell you where to start.
Cross-reference your survey data with behavioral analytics. Users who scored the onboarding flow poorly and also dropped off at the integration step: that's where you focus first. Survey data and product analytics are most powerful when they're pointing at the same problem from different angles.
Close the Loop: What Changes, and How Fast
Prioritize by the combination of frequency (how many users reported this?) and severity (how badly does it affect task completion?). A confusing label that affects 60% of users in their first week is more important than a complex edge case affecting 3% of responses.
Make changes iteratively and track score movement. If post-task SEQ scores for a specific workflow averaged 4.2 and you redesign the confirmation state, the next cohort's scores should tell you whether the fix worked. Survey, fix, resurvey. That cycle is how product experience improves systematically rather than sporadically. For the full mechanics of how this cycle connects across your product, see product feedback loop.
Close the loop with users where you can. If someone flagged a specific problem and you fixed it in the next release, telling them is one of the highest-ROI communications you can send. It's rare enough that users notice.
For using UX survey findings to shape a longer-term roadmap process, see our guide to product experience strategy. And for translating findings into concrete product changes, how to improve product experience covers the implementation side.
Build a Continuous Feedback Loop, Not a One-Time Survey Program
Product teams that improve experience consistently run UX surveys on a cadence, not just when something breaks. Quarterly SUS benchmarking across your core workflows gives you a trend line. That trend line is more useful than any single data point: it shows whether your investment in UX is actually moving scores, and which releases helped versus hurt.
A/B testing pairs well with UX surveys. Run two versions of a workflow, survey both cohorts with the same questions, and compare scores alongside behavioral metrics. You get quantitative behavioral data and subjective experience data simultaneously, which is about as close to a complete picture as product research gets.
UX Survey Metrics: SUS, UMUX-Lite, and SEQ
Most UX survey guides stop at question examples. The harder part is knowing when you have enough data, how to interpret your scores, and what "good" actually looks like for your product. Three standardized instruments do most of the work here — and they're not interchangeable.
SUS (System Usability Scale) is a 10-item questionnaire that gives you a single usability score for your product. It's technology-agnostic, which means you can use the same instrument across releases, across platforms, and against an external benchmark. The industry average SUS score is 68. Above 80 is excellent. Below 50 points to structural problems: navigation, information architecture, task flow. Not just surface-level polish. To run SUS with your users, our system usability survey template has all 10 items pre-configured and ready to deploy.
UMUX-Lite is a 2-item proxy that correlates strongly with SUS scores. When survey length is a constraint and you can't ask 10 questions, UMUX-Lite gives you a directionally reliable read in a fraction of the time. It measures perceived usefulness and ease of use. Good for pulse checks between full SUS benchmarking cycles.
SEQ (Single Ease Question) is exactly what it sounds like: one item, asked immediately after a specific task. "Overall, how easy was it to complete this task?" on a 7-point scale. It's not designed to benchmark the whole product. It's designed to tell you which specific workflow is creating friction. Run SEQ at every major task point in your onboarding flow and you'll see exactly where users are struggling — before the drop-off data shows up in your analytics.
The practical rule: use SUS or UMUX-Lite when you want to know how the product feels overall. Use SEQ when you want to know why a specific step is failing.
Start Turning UX Survey Data Into Product Decisions
Product teams that improve experience consistently aren't running more surveys than everyone else. They're connecting survey data to decisions faster. The actual skill is knowing which question to ask, timing it to the right moment, reading results quickly, and acting before the insight goes stale.
Zonka Feedback lets you deploy UX surveys across every product surface: in-app, web, email, and in-product, with AI analysis that surfaces patterns in open-text responses without manual tagging. Your team spends time deciding what to fix, not reading through survey comments.
Schedule a demo to see how it works in your product context. Or start with our user experience survey template, pre-built question structure ready to deploy.


